
POLL TAKEAWAYS: Latinos & Misinformation
Findings from “On Disinformation, Distrust, and Democracy: A DDIA Poll of U.S. Latinos” released June 25, 2024
See Also:
The Digital Democracy Institute of the Americas (DDIA) partnered with YouGov to conduct a nationally representative poll of 3,000 U.S. Latino adults, from March 11 to April 26, 2024, in English and Spanish.
The poll explored the four key topics below. This article outlines takeaways from the highlighted areas:
Familiarity with and belief in misinformation in the 2024 context,
The role of political identities and values in relation to engagement with misinformation,
Levels of trust in institutions and the electoral process, and
Perceptions about artificial intelligence’s influence in the online world.
How Much Are Latinos Engaging with Misinformation Online?
Latinos see a lot of misinformation, but are also very skeptical of what they see.
This is good and bad. Latinos are critically evaluating information, but they’re very skeptical (distrusting) of content online in general.
Latinos are mostly uncertain when it comes to misinformation.
We tested 7 misleading and/or conspiratorial narratives and 15 false claims (see full list of both in the appendix).
62% of the 3,000 Latinos surveyed either outright rejected the misinformation claims we tested, or were not sure if what they saw was true or false.
Using the DDIA misinformation typology, we segmented this poll's sample into six groups based on the degree to which they see misinformation and believe it. We calculated the percentage of our sample falling into each one of these different categories.
Category 1: Misinformation adopters (those who see and believe more misinformation on average): 30.6% of respondents
Category 2: Niche believers (those who see less misinformation on average, but believe more of what they see): 7.5% of respondents
Category 3: Unexposed and uncertain (those who see less misinformation on average, but are uncertain about whether what they have seen is true or false): 22.9% of respondents
Category 4: Exposed and uncertain (those who see more misinformation on average, but are uncertain): 13.2% of respondents
Category 5: Niche discerners (those who see less misinformation on average, but reject what they see): 2.9% of respondents
Category 6: Discerning (those who see and reject more misinformation on average): 22.9% of respondents
Which False Narratives (‘Stories that Connect Dots’) do U.S. Latinos See and Believe the Most?
Broader misleading and conspiratorial narratives about elites and the state of the world (see full list of narratives tested in the appendix) are becoming prevalent and have high acceptance among those who have been exposed to them.
Still, many Latinos in our sample express uncertainty around misinformation narratives, with estimates ranging from 32% uncertainty for the “election fraud” narrative to 51% uncertainty for the “Russian control” narrative (see full list of narratives tested in the appendix).
Latinos are familiar with and believe in the following misinformation narratives at the following rates:
“Traditional values are being eroded by a leftist political agenda that is being implemented in schools.”
(50% have seen this narrative;
among those who have seen this narrative, 42% accept it;22% of the total sample have seen and believe this narrative)
“There is a Deep State composed of shadowy political figures that is working against the public.”
(54% have seen this narrative;
among those who have seen the narrative, 42% accept it;21% of the total sample have seen and believe this narrative)
“Corporations are all-powerful in American politics, with little room for the public to make a difference.”
(57% have seen this narrative;
among those who have seen the narrative, 50% accept it;28% of the total sample have seen and believe this narrative)
“Elites are plotting with mainstream media outlets and social media companies to censor the truth.”
(54% have seen this narrative;
among those who have seen the narrative, 47% accept it;26% of the total sample have seen and believe this narrative)
Which False Claims (‘Statements’) do U.S. Latinos See and Believe the Most?
The most widely seen claims are also the most likely to be rejected, likely because they have been fact-checked at high rates. This was also found in the Equis 2022 misinformation poll.
Over 40% of Latinos reported having seen the following false claims:
“COVID-19 vaccines can lead to more serious health issues like myocarditis and infertility that would otherwise not be observed among those who catch COVID-19”
“Trump won the 2020 election”
“Polls are being manipulated to distort public opinion”
“Democrats are failing to secure the U.S. southern border in order to allow undocumented immigrants to vote for them in U.S. elections”
“Donald Trump was named on the “Epstein List” that was released, a list featuring famous individuals who traveled with known convicted sex offender Jeffrey Epstein”
“Giving kids vaccines can cause autism”
The most widely believed false claim was that “Trump was on ‘Epstein’s list’.”
54% of those who had seen the claim above believed it.
Other claims that were widely believed among the people that had seen them were:
“Polls are being manipulated to distort public opinion”
(42% acceptance among those who had seen the claim; 22% of the total sample have seen and believe this claim)
“Democrats are failing to secure the U.S. southern border in order to allow undocumented immigrants to vote for them in U.S. elections”
(41% acceptance among those who had seen the claim; 22% of the total sample have seen and believe this claim)
“COVID-19 vaccines can lead to more serious health issues like myocarditis and infertility that would otherwise not be observed among those who catch COVID-19”
(39% acceptance among those who had seen the claim; 22% of the total sample have seen and believe this claim)
The most widely rejected claims included “vaccines cause autism” and “Trump won in 2020.”
Between 40% and 42% of our sample who had seen these claims rejected them.
Though important to note that ⅓ Latinos believe that Trump won in 2020.
Which Latinos are Most Likely to be Discerning (Able to Accurately Differentiate between True and False Content)?
More Discerning: Latinos who report having high levels of political interest and higher levels of education show higher levels of being able to accurately detect and differentiate between true and false content.
Older Latinos are also more able to differentiate between true and false content, aligning with findings from the general population.
Accuracy rates on the Misinformation Susceptibility Test (MIST) are:
60% for ages 18-29,
62% for ages 30-44,
61% for ages 45-54,
65% for ages 55-64, and
68% for ages 65 and older.
Less Discerning: Latinos who identify as having Republican partisanship, high levels of partisan intensity, and who consume Spanish-language media were less able to accurately detect and differentiate between true and false content.
Which Latinos are Most Likely to See Misinformation?
Latinos who have high levels of interest in politics are MORE likely to see misinformation online.
The more politically interested Latinos are, the more likely they are to see misinformation.
Latinos who consume a lot of right-wing news and information on social media are MORE likely to see misinformation online.
Latinos who consume Spanish-language media, such as Telemundo and Univision, tend to see LESS misinformation.
Older Latinos (65+) are LESS likely to see false claims online in comparison to younger Latinos (18-29).
Which Latinos are Most Likely to Believe Misinformation?
Older respondents are less likely to see misinformation, are more likely to believe the false claims they have seen, despite their higher levels of accuracy when it comes to being able to discern between true and false content.
The discrepancy between older Latinos being both more accurate but also more likely to believe misinformation could come down to them being more confident in their responses. Older Latinos are more willing to say they are more sure something is true or false, versus being uncertain.
Latinos who consume a lot of right-wing media consumption and a lot of social media, who have high political interest, and who exhibit conspiratorial orientations are also more likely to believe misinformation.
Spanish-language media consumers tend to see less misinformation, they also score lower on discernment, which means higher exposure to misinformation as the election nears could lead to greater belief in misinformation.
How Should Resources be Allocated to Counter Misinformation Among Latinos?:
There is no one-size-fits-all approach to combating misinformation within the Latino community. All interventions work - they just work better for different subgroups.
When it comes to targeting Latinos with debunking and prebunking interventions, DDIA recommends engaging:
Higher-priority Latinos (who have yet to see a lot of misinformation and who are more likely to respond to interventions because they don’t have concrete beliefs in misinformation one way or the other), as opposed to
Lower-priority Latinos, (who are already very able to differentiate between true and false content or who may already have more fixed beliefs.)
Higher-priority Latinos can be divided into three main groups:
Those who are uncertain.
Those with low exposure to misinformation but who accept some claims.
Those with low exposure who reject some claims.
Though psychological variables and media consumption are much more significant in predicting whether someone will engage with misinformation, below are some recommendations when considering demographics:
Higher-priority Latinos tend to be women, Facebook users, and Spanish-dominant. They also consume slightly more broadcast news and Spanish-language media.
More on Spanish: Spanish-dominant Latinos, compared to their English-dominant counterparts, often show greater uncertainty and are less inclined to dismiss claims they encounter. They also see fewer claims overall. Politically, 41% identify as independents—higher than the 28% among English-dominant Latinos—and only 40% regularly follow politics, compared to 55%. This limited exposure to both false content and political content in general may hinder their ability to recognize and reject misinformation effectively.
Lower-priority Latinos are more likely to consume podcasts, use Twitter/X and YouTube, engage with ideological media, identify as first-generation Latinos, watch cable news outlets (e.g., CNN, MSNBC, and Fox News), and identify as Republican.
While there are differences between higher and lower-priority groups, focusing efforts on platforms like YouTube, Facebook, and Instagram could be beneficial overall, as large portions of Latinos consume media on these platforms.
APPENDIX -
FULL LIST OF NARRATIVES TESTED
Narratives - defined as an account of connected events; a story.
Democrats have won elections by resorting to fraud and electoral manipulation.
Vaccines are a form of population control supported by elites and large corporations.
There is a Deep State composed of shadowy political figures that is working against the public.
Traditional values are being eroded by a leftist political agenda that is being implemented in schools.
Russia is controlling American politics by undermining our elections and causing rifts between Americans.
Corporations are all-powerful in American politics, with little room for the public to make a difference.
Elites are plotting with mainstream media outlets and social media companies to censor the truth.
FULL LIST OF CLAIMS TESTED
Claims - defined as a statement or assertion, often with no proof.
Trump won the 2020 election.
Antifa was responsible for the January 6th insurrection.
January 6 was a false flag operation orchestrated by the U.S. federal government and law enforcement.
Democrats are failing to secure the U.S. southern border in order to allow undocumented immigrants to vote for them in U.S. elections.
Trump worked with Russians to steal the presidency in 2016.
Police, not protestors, were responsible for damage to buildings during the Black Lives Matter protests of 2020.
Donald Trump was named on the “Epstein List” that was released, a list featuring famous individuals who traveled with known convicted sex offender Jeffrey Epstein.
Putin warned the U.S. to stay away from the “Israel-Hamas” war.
Giving kids vaccines can cause autism.
COVID-19 vaccines can lead to more serious health issues like myocarditis and infertility that would otherwise not be observed among those who catch COVID-19.
Polls are being manipulated to distort public opinion.
Amazon delivery drones will be supplied by the U.S. military.
The U.S. government is planning on selling Alaska back to Russia to pay off the national debt.
The United Nations has proposed the adoption of Global Coin, a digital currency that will unify all existing currencies.
The U.S. Department of Education is planning to make an online activism course mandatory for students nationwide.
GRAPHS
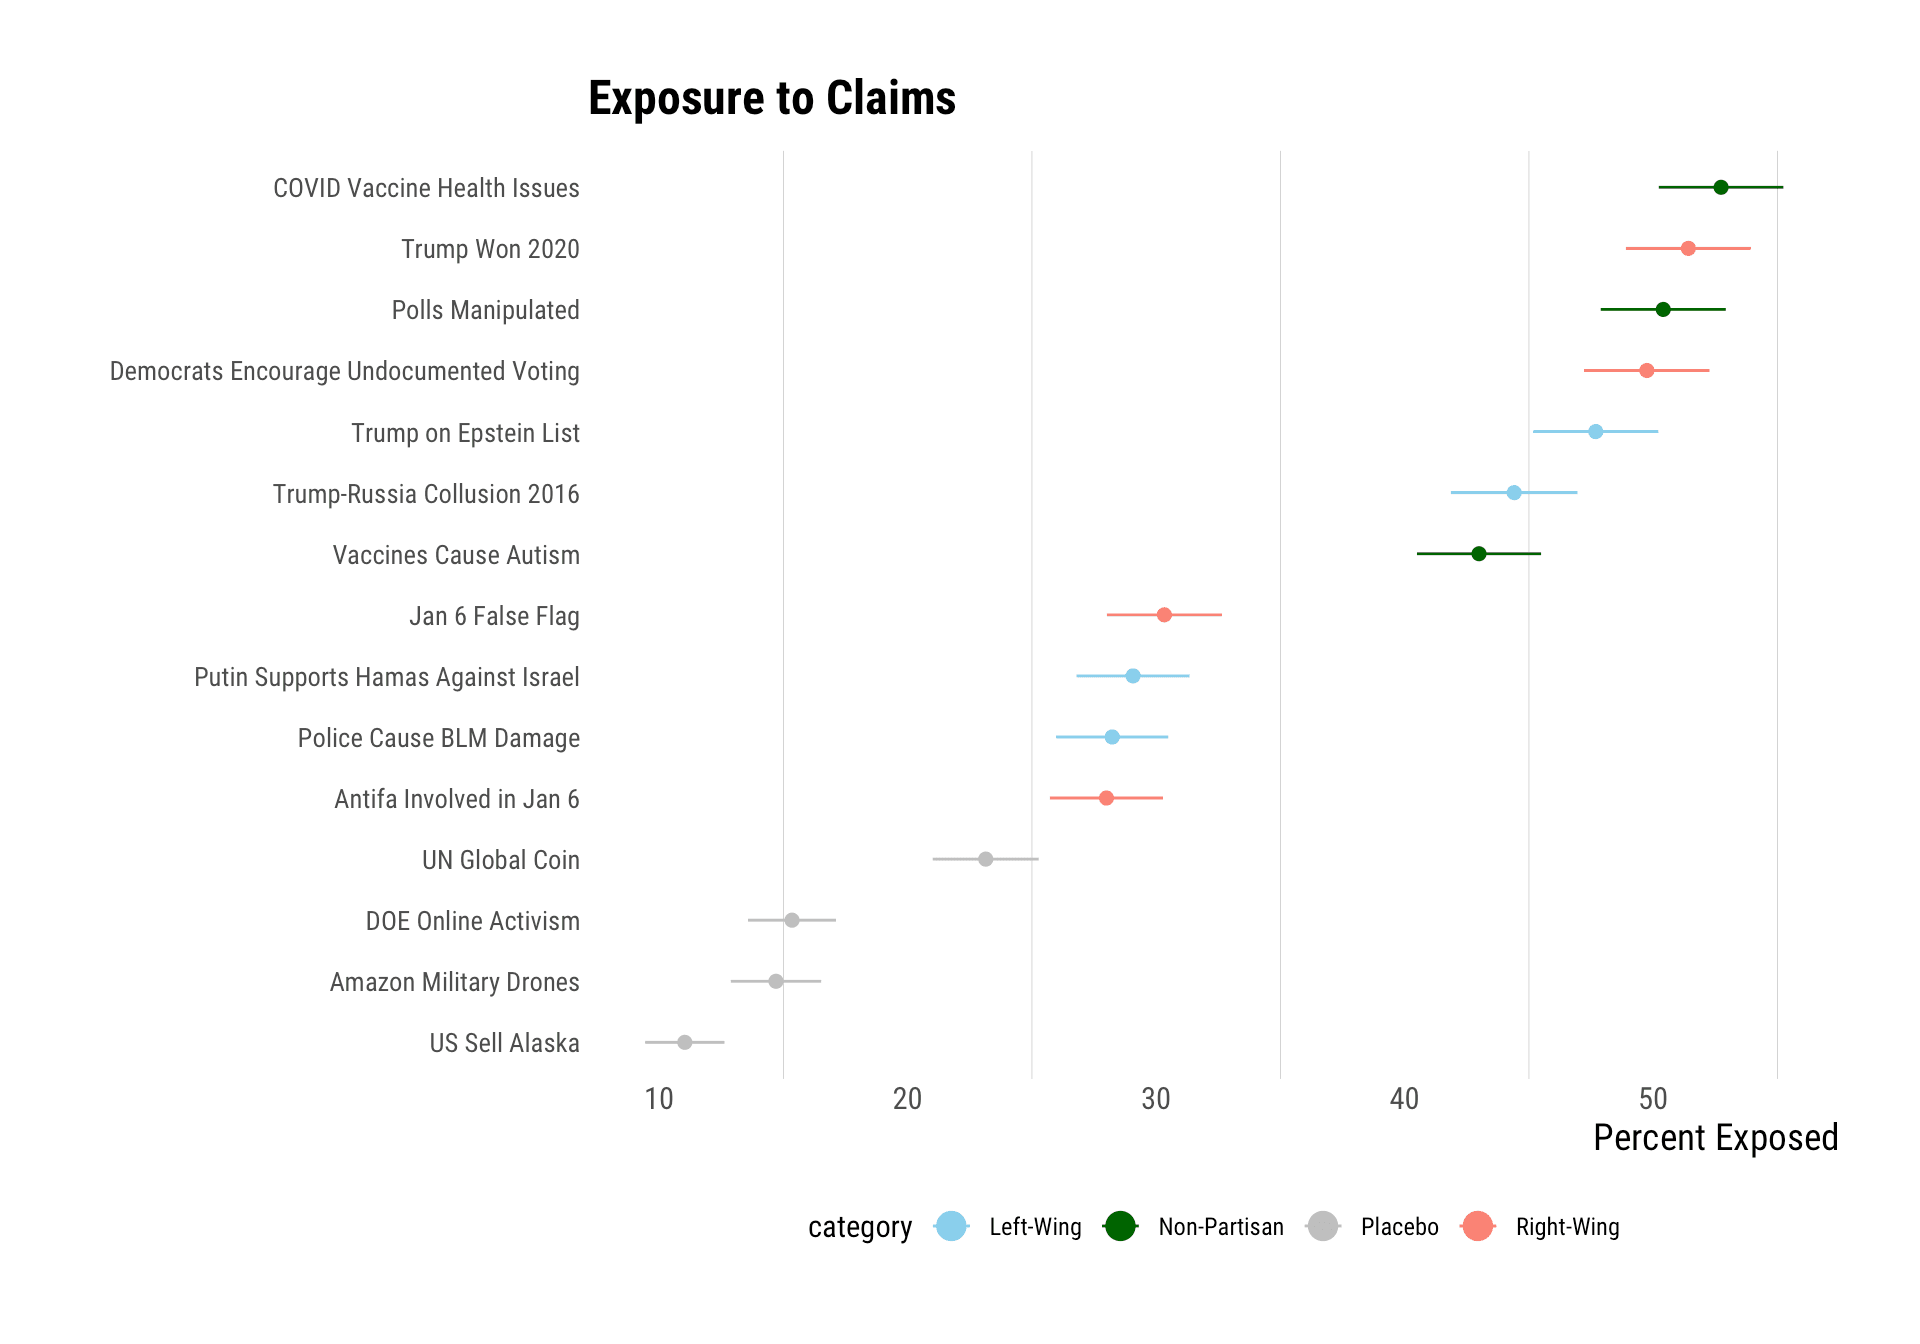
Figure 1. Percentage of Latinos in our sample who reported being exposed to each claim.
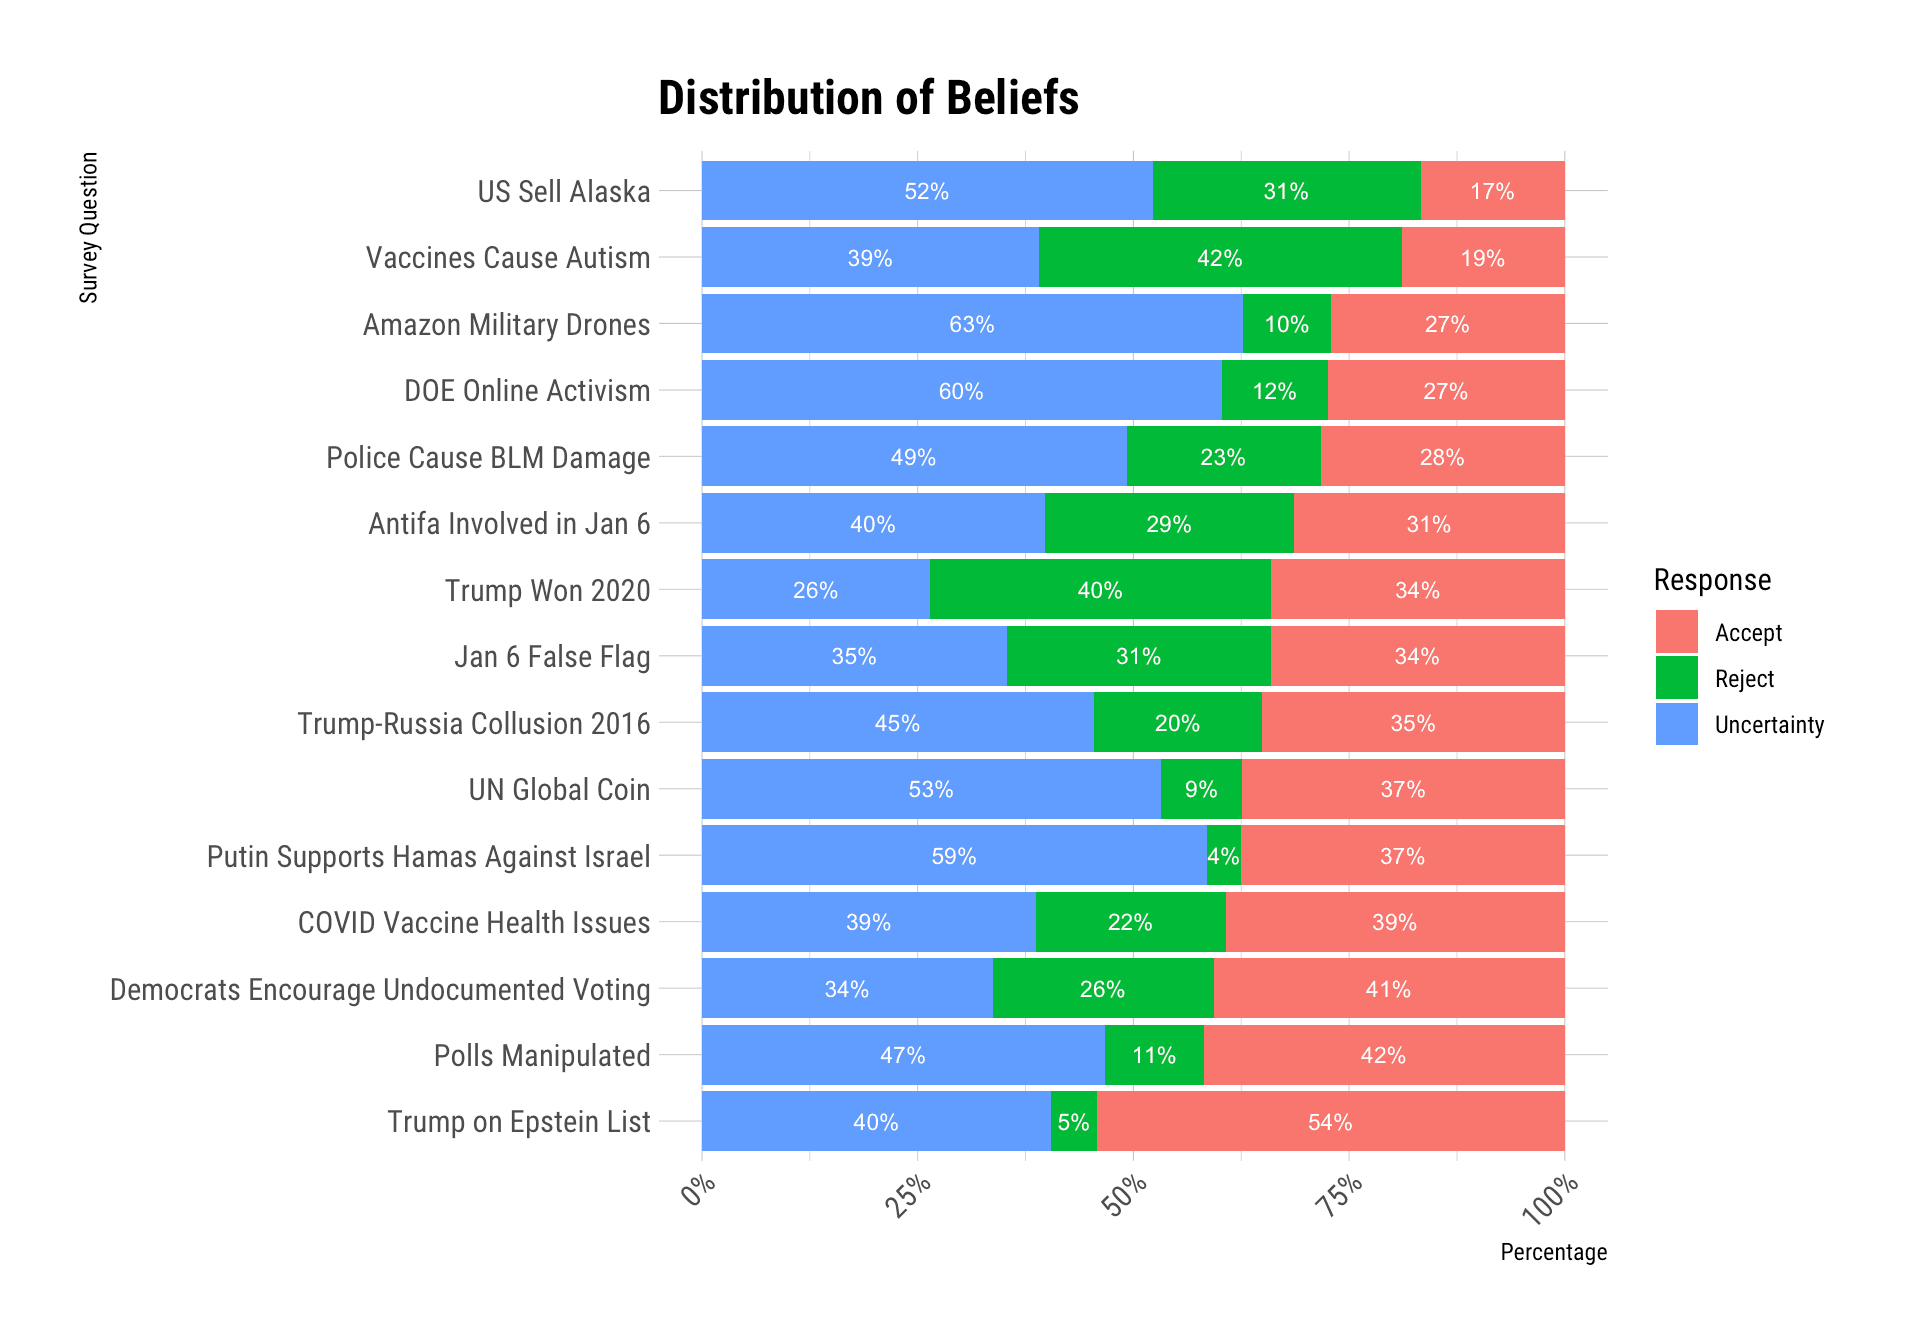
Figure 2. Distribution of beliefs among those exposed to each claim. Blue bars indicate the percentage of those exposed who reported being uncertain. Red bars represent the percentage who accepted the claim. Green bars represent the percentage who rejected the claim.
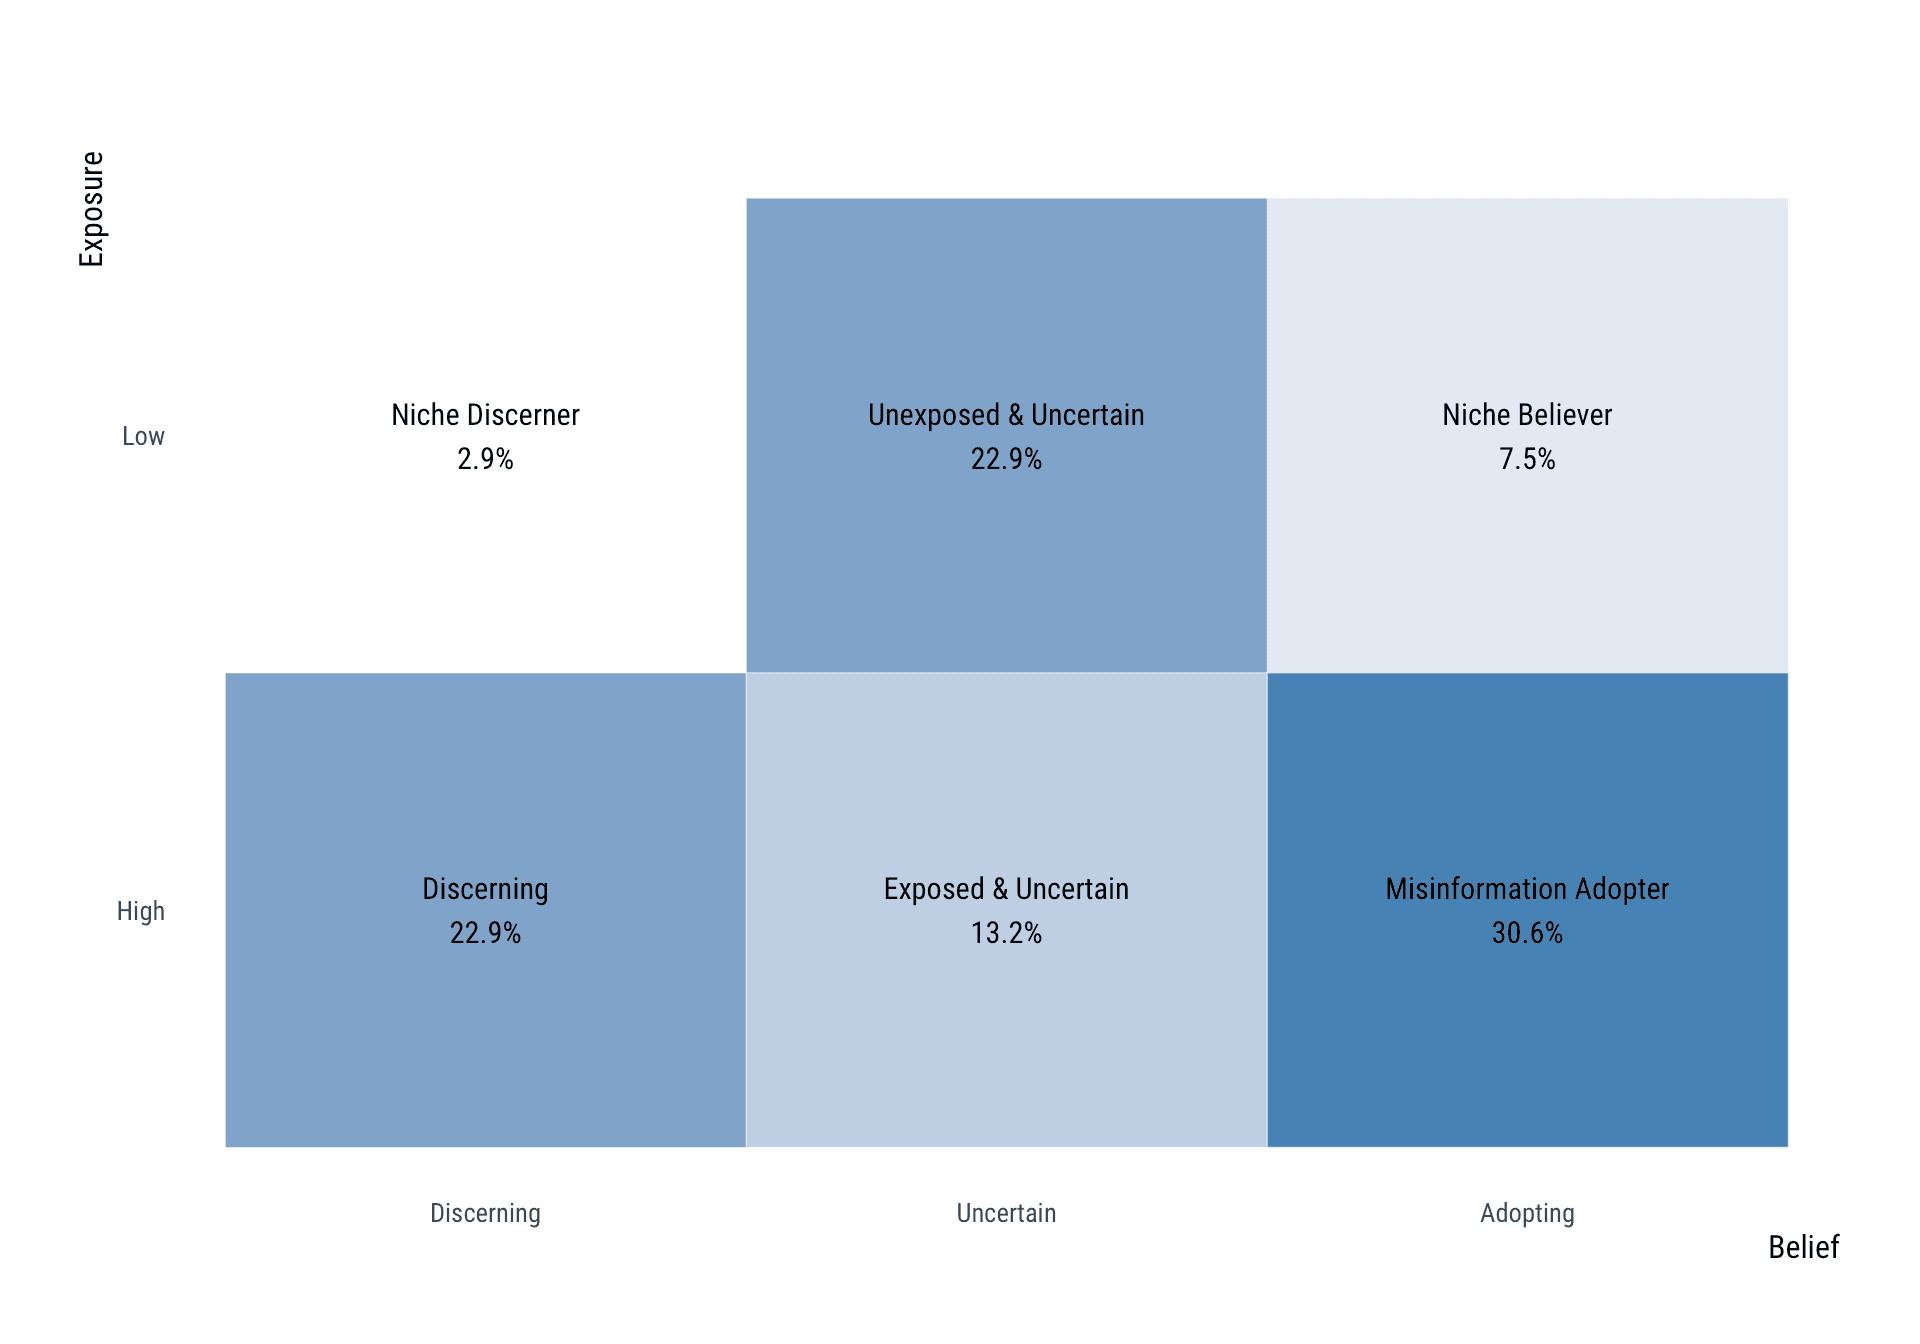
Figure 3. Distribution of Latinos belonging to different subgroups in the DDIA typology. The x-axis ranges from discernment to adoption, the y-axis ranges from lower to higher exposure.
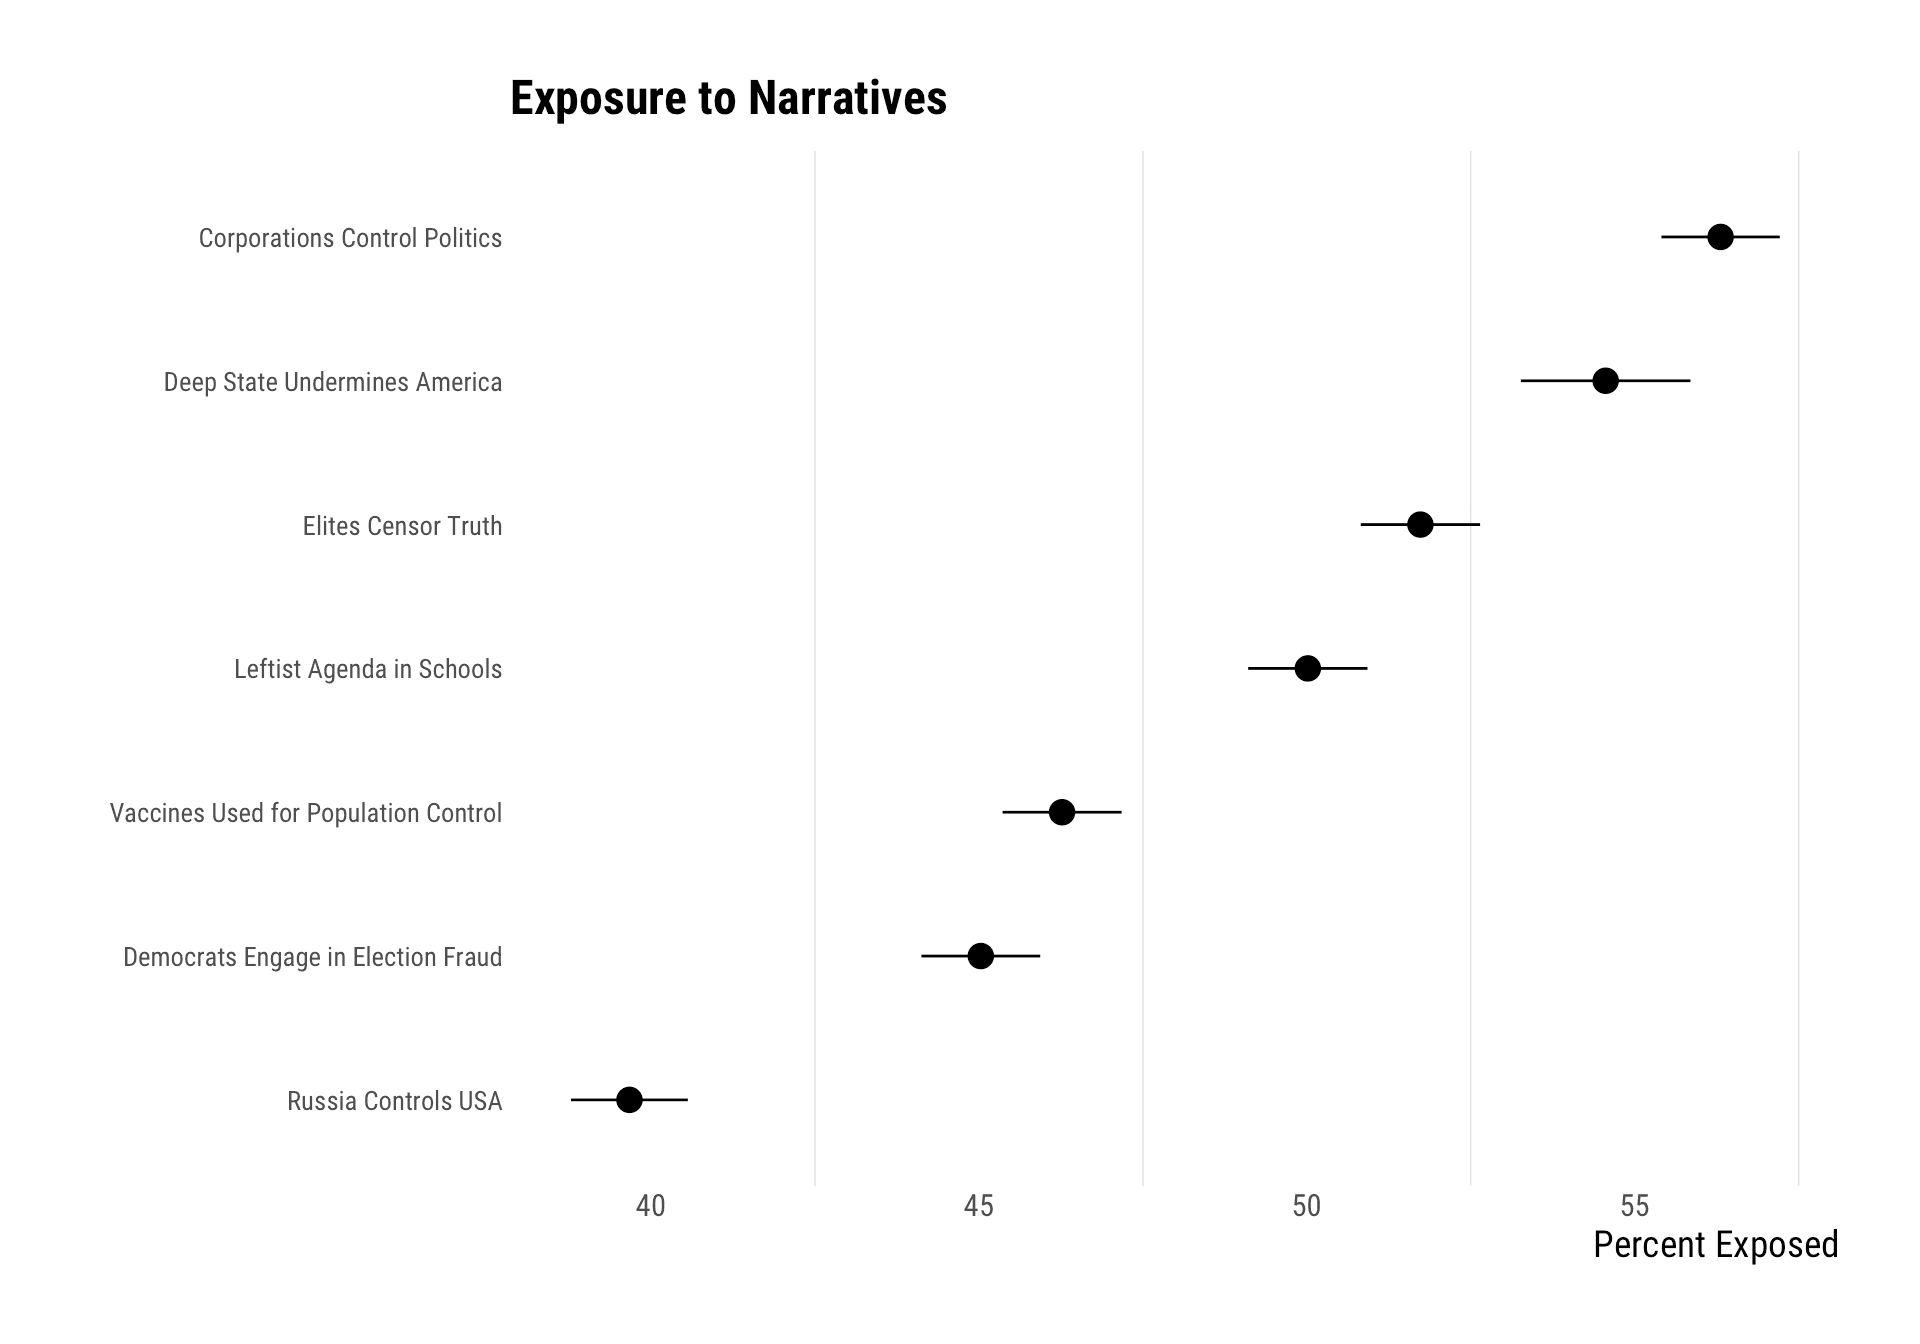
Figure 4. Percentage of Latinos in our sample who reported being exposed to each narrative.
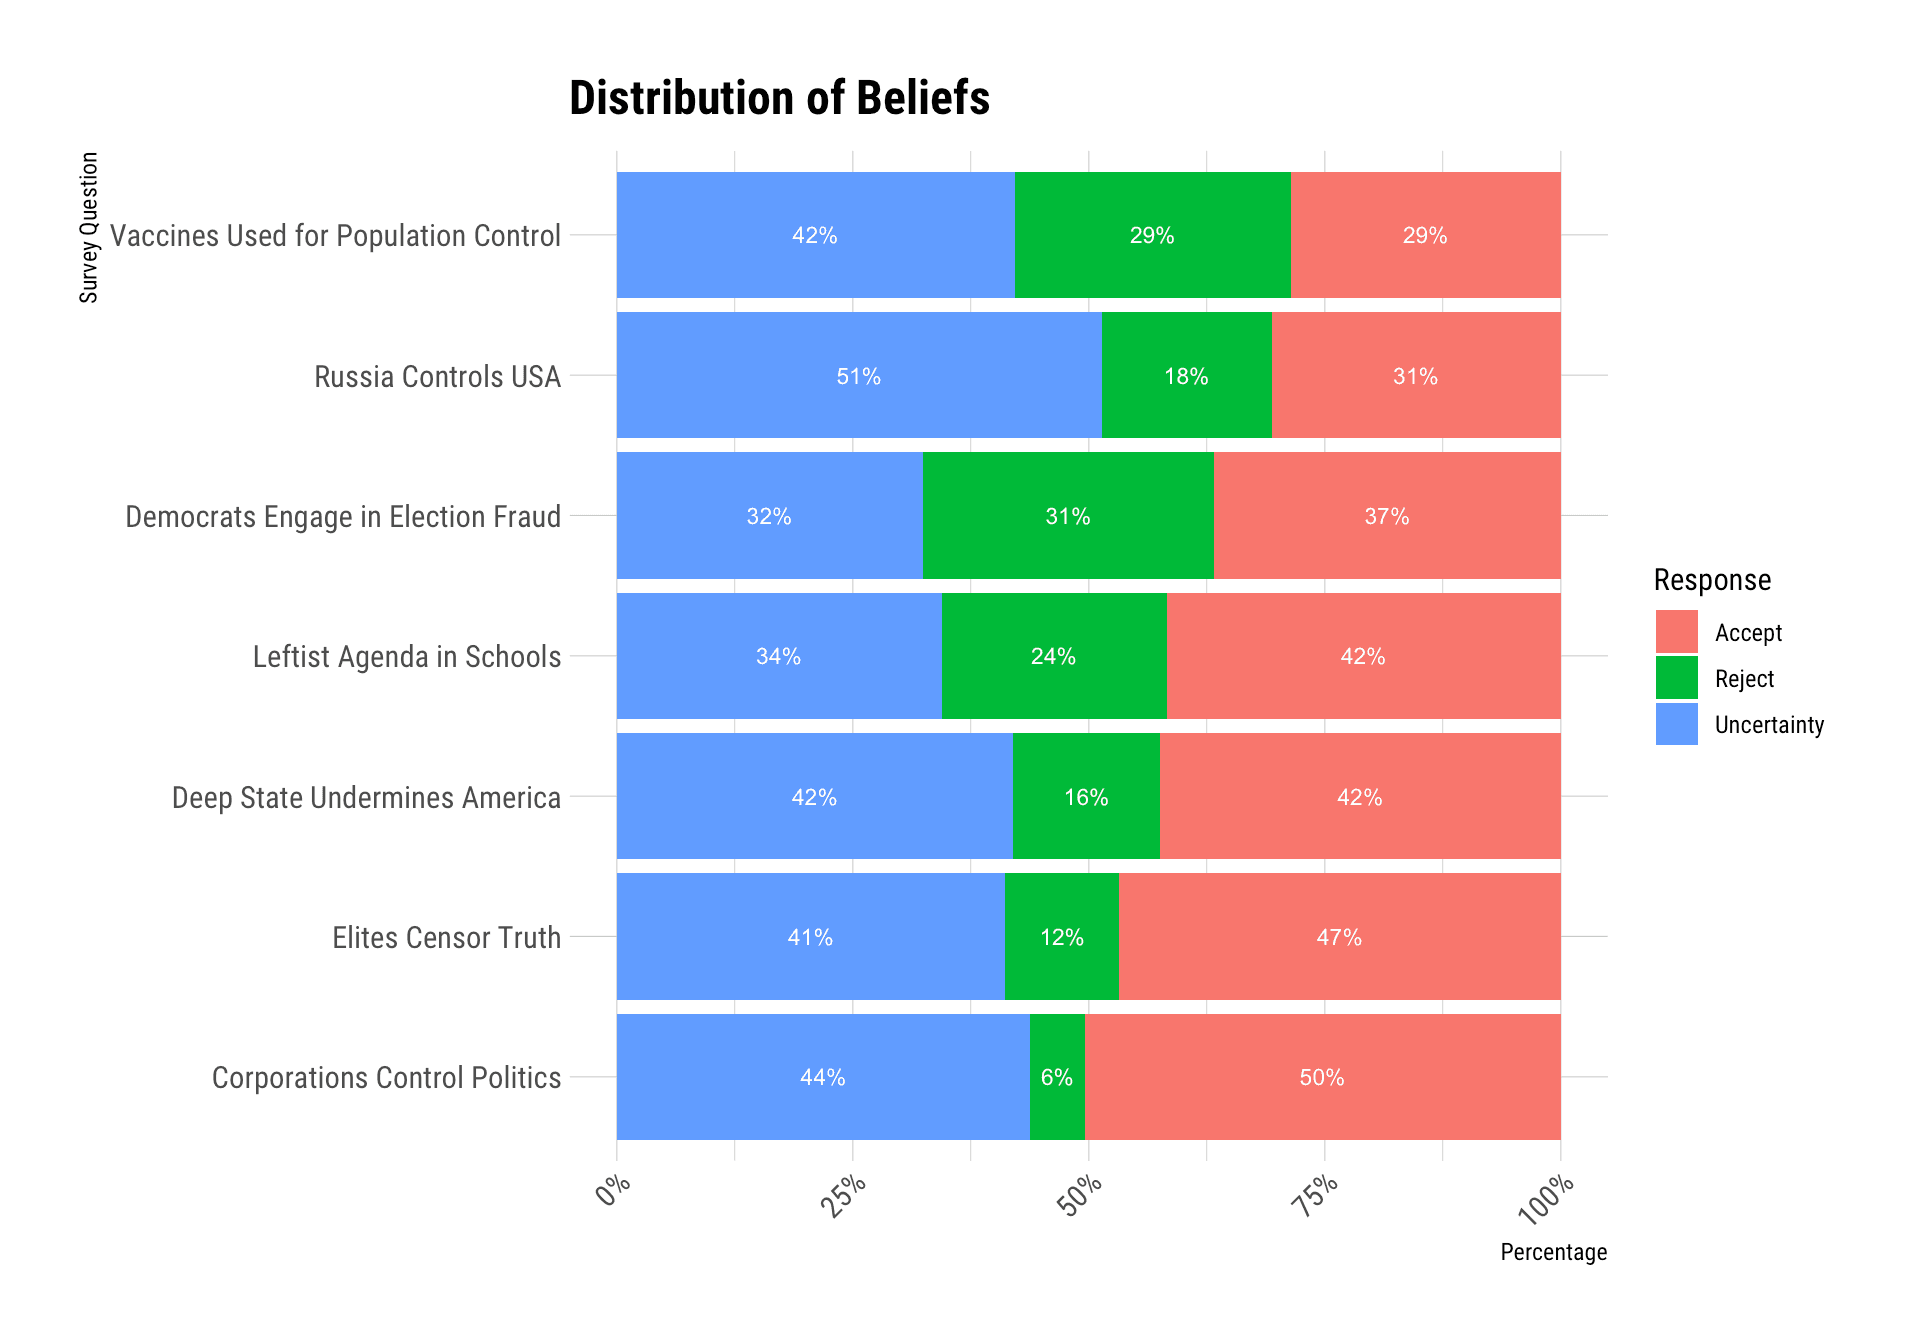
Figure 5. Distribution of beliefs among those exposed to each narrative. Blue bars indicate the percentage of those exposed who reported being uncertain. Red bars represent the percentage who accepted the narrative. Green bars represent the percentage who rejected the narrative.
DOWNLOAD LATINOS & MISINFORMATION TAKEAWAYS PDF
Download