
POLL TAKEAWAYS: Latinos & Trust
Findings from “On Disinformation, Distrust, and Democracy: A DDIA Poll of U.S. Latinos” released June 25, 2024
See Also:
DDIA Poll Takeaways - Latinos & Misinformation (June 25, 2024)
DDIA Poll Takeaways - Latinos & AI (June 25, 2024)
The Digital Democracy Institute of the Americas (DDIA) partnered with YouGov to conduct a nationally representative poll of 3,000 U.S. Latino adults, from March 11 to April 26, 2024, in English and Spanish.
The poll explored the four key topics below. This doc outlines takeaways from the highlighted area:
Familiarity and belief in misinformation in the 2024 context,
The role of political identities and values in relation to engagement with misinformation,
Levels of trust in institutions and the electoral process, and
Perceptions about artificial intelligence’s influence in the online world.
Which Election Officials do Latinos Trust Most and Least?
Latinos’ trust in election officials is strongly correlated with partisanship.
Latino Democrats are more likely to trust election officials such as poll workers and secretaries of state.
Latino Republicans, Latinos who hold conservative views, and Latinos who score high on conspiratorial orientations, rate election authorities and actors lower on trust compared to their Democratic counterparts. Whereas Latino Republicans largely express ambivalence about election officials such as poll workers and secretaries of state, Latino Democrats are more likely to express trust in these actors.
The most partisan Latinos on both sides of the spectrum generally distrust the other side’s handling of elections.
Which Other Democracy-related Stakeholders do Latinos Trust Most and Least?
Latinos’ trust in a broader set of social and political groups, including tech companies, fact-checkers, journalists, scientists, and media organizations is also correlated with partisanship.
Latino Democrats are largely ambivalent about tech companies, whereas Latino Republicans lean toward distrusting tech companies.
Democrats lean toward trusting fact-checkers and local journalists, whereas Latino Republicans express ambivalence about these groups.
Scientists emerge as the only group that is trusted by both Latino Republicans and Democrats, albeit to different degrees.
What More Do We Know About Trust Along Party Lines?
Virtually no stakeholders are trusted similarly across partisan lines, with large partisan gaps evident when respondents rate the other side.
The only exception to this pattern is trust in neighbors, which could be attributed to factors such as proximity or residential sorting patterns (because people live among others who are like them - Democrats living among other Democrats, Republicans living among other Republicans).
Scientists emerge as the group that comes closest to being trusted similarly along partisan lines. This bipartisan trust in scientists suggests potential avenues for bridging partisan divides and fostering greater trust in credible information sources.
While partisan gaps are smaller in other cases, such as trust in Congress and social media, these gaps reflect shared ambivalence across partisan subgroups rather than genuine trust.
Democrats tend to trust media outlets more than Republicans, with Fox News being the exception to this trend.
How Does Trust Connect with Latinos Feeling Like Their Participation in Elections Matters?
Latinos with stronger partisan identities report feeling like they can have higher political impact (efficacy) in elections.
Older respondents, women, Republicans, and those with higher levels of conspiratorial views report lower efficacy.
Many of these same subgroups also distrust election officials and have doubts about whether their votes will be properly counted.
Yet, some individuals who distrust the political system and report lower levels of efficacy still report an intention to vote in 2024, indicating participation can occur even with doubts about the political process.
Confidence in one’s own vote being properly counted and self-reported likelihood of voting are also influenced by several factors.
High partisan intensity, education, political interest, and news consumption consistently emerge as positive predictors of these attitudes, while holding conspiratorial views and Republican identification is negatively associated with vote confidence (with more muted associations with voting likelihood).
High levels of partisanship and conspiratorial orientations contribute to feelings of distrust in democratic processes among Latinos.
Republican party affiliation consistently predicts lower levels of trust and confidence that one’s vote will count.
Does Trust in Elections Predict Voter Turnout?
For some groups of Latinos, participating in elections may not hinge on whether they trust the political process. Some Latinos choose to participate in spite of beliefs of “rigged elections” or untrustworthy officials.
For example, older Latinos above the age of 65 are less likely to perceive their participation in elections to matter relative to those who have recently reached voting age (ages 18-29), but are more likely to report a desire to turnout to vote.
Latinos with higher levels of conspiratorial orientation also predict lower efficacy, trust, and confidence that one’s vote will be counted. However, these factors don’t seem to have a strong association with whether they report wanting to turnout or not to vote.
APPENDIX -
FULL LIST OF STAKEHOLDERS MEASURED FOR TRUST:
We measured trust in election-related groups such as:
Secretaries of State
Poll Workers
Election Administrators
Democrats
Republicans
The President
As well as other actors:
The Supreme Court
Congress
Religious Leaders
Activists
Media organizations (CNN, MSNBC, Fox News, Telemundo, Univision)
Journalists
Local Journalists
Fact-Checkers
Political Parties
Religious Leaders
Tech Companies
Social Media
Scientists
Neighbors
GRAPHS:
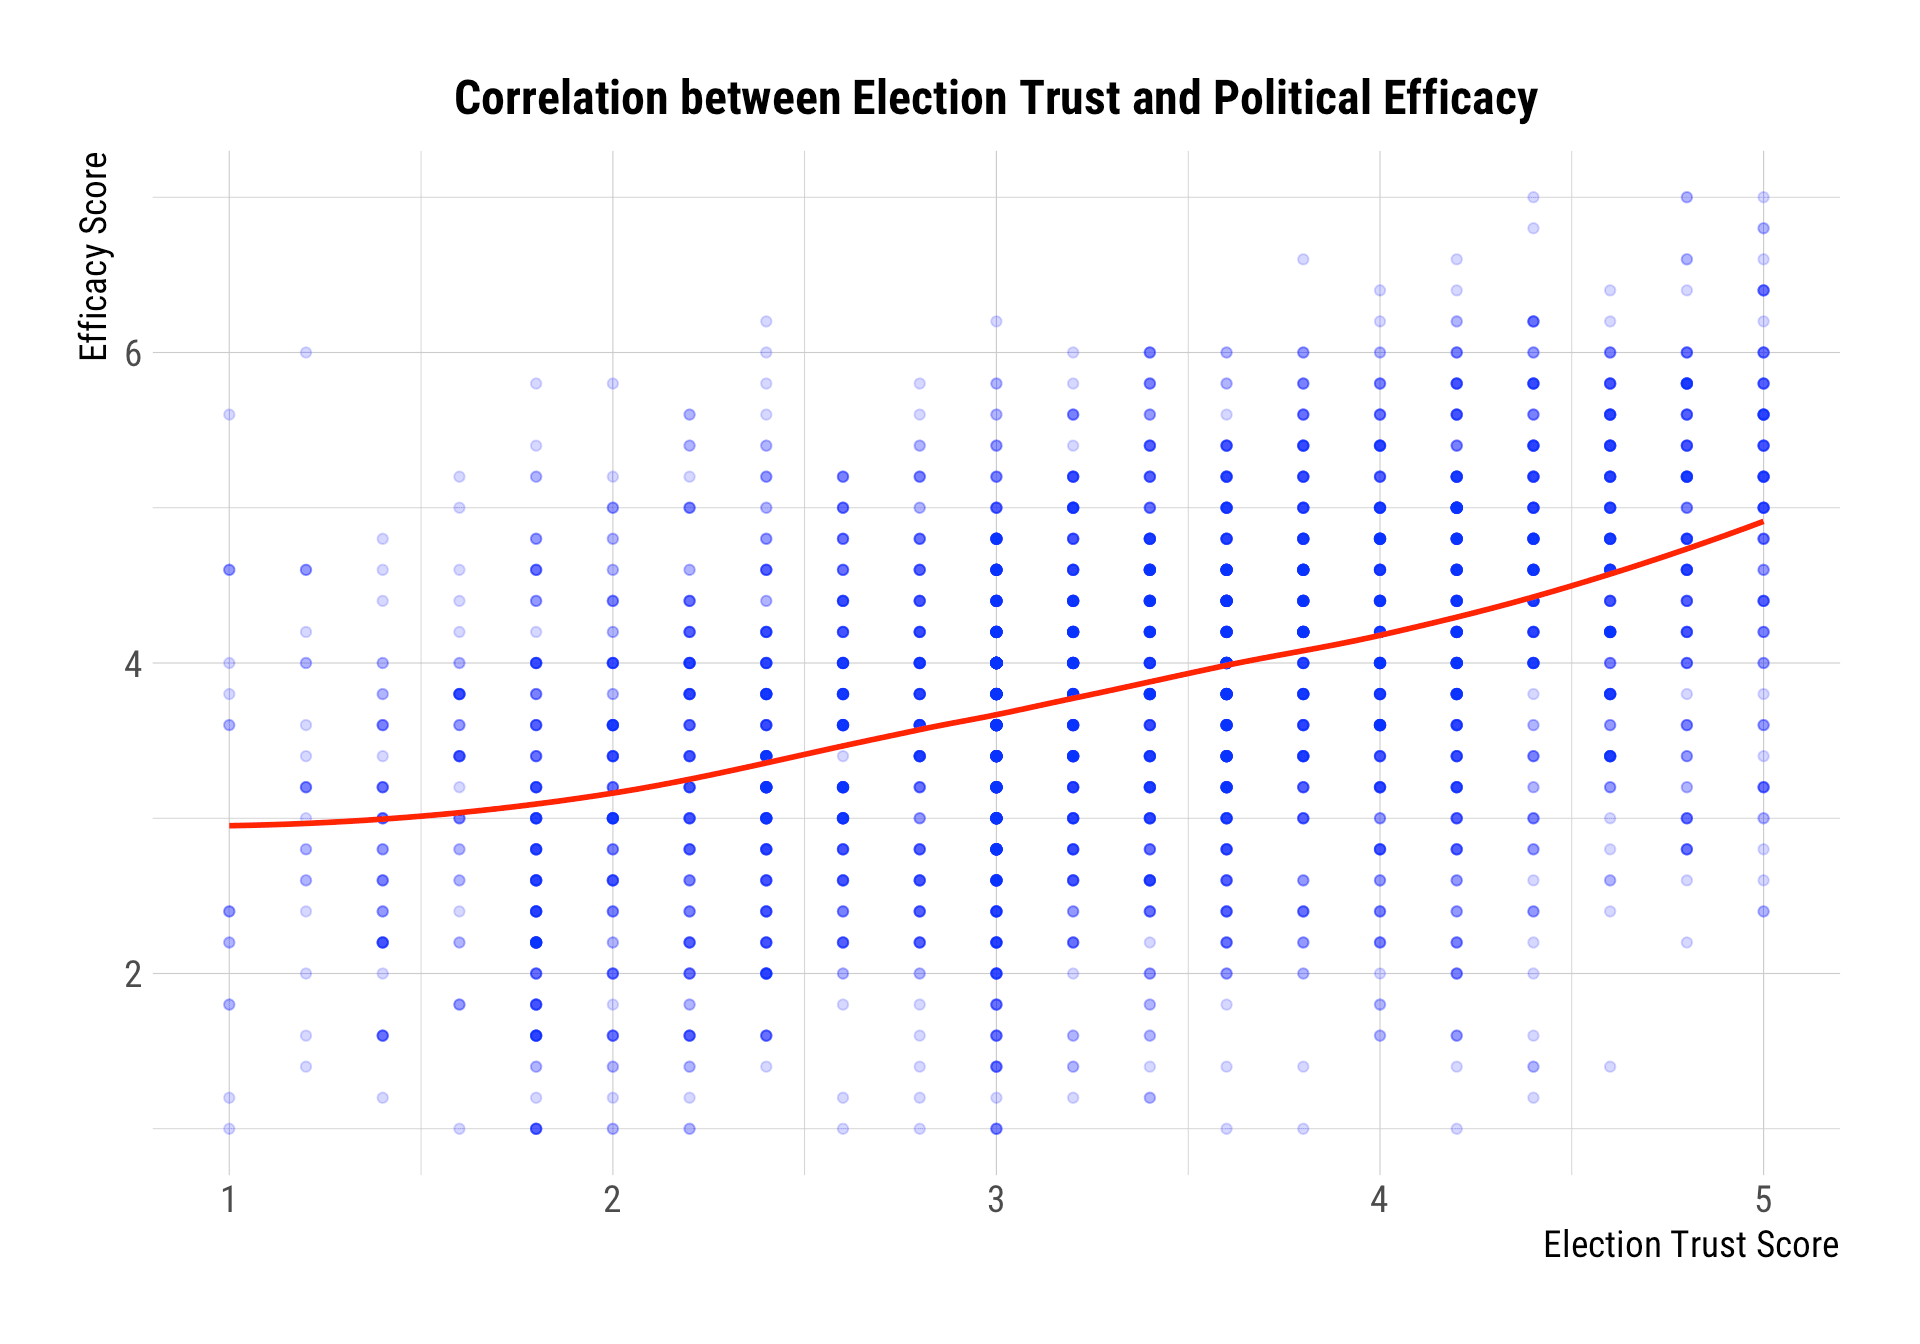
Figure 8. Mean trust estimates for Latino Republicans and Latino Democrats. Red points represent estimates for Republicans; blue points represent estimates for Democrats.
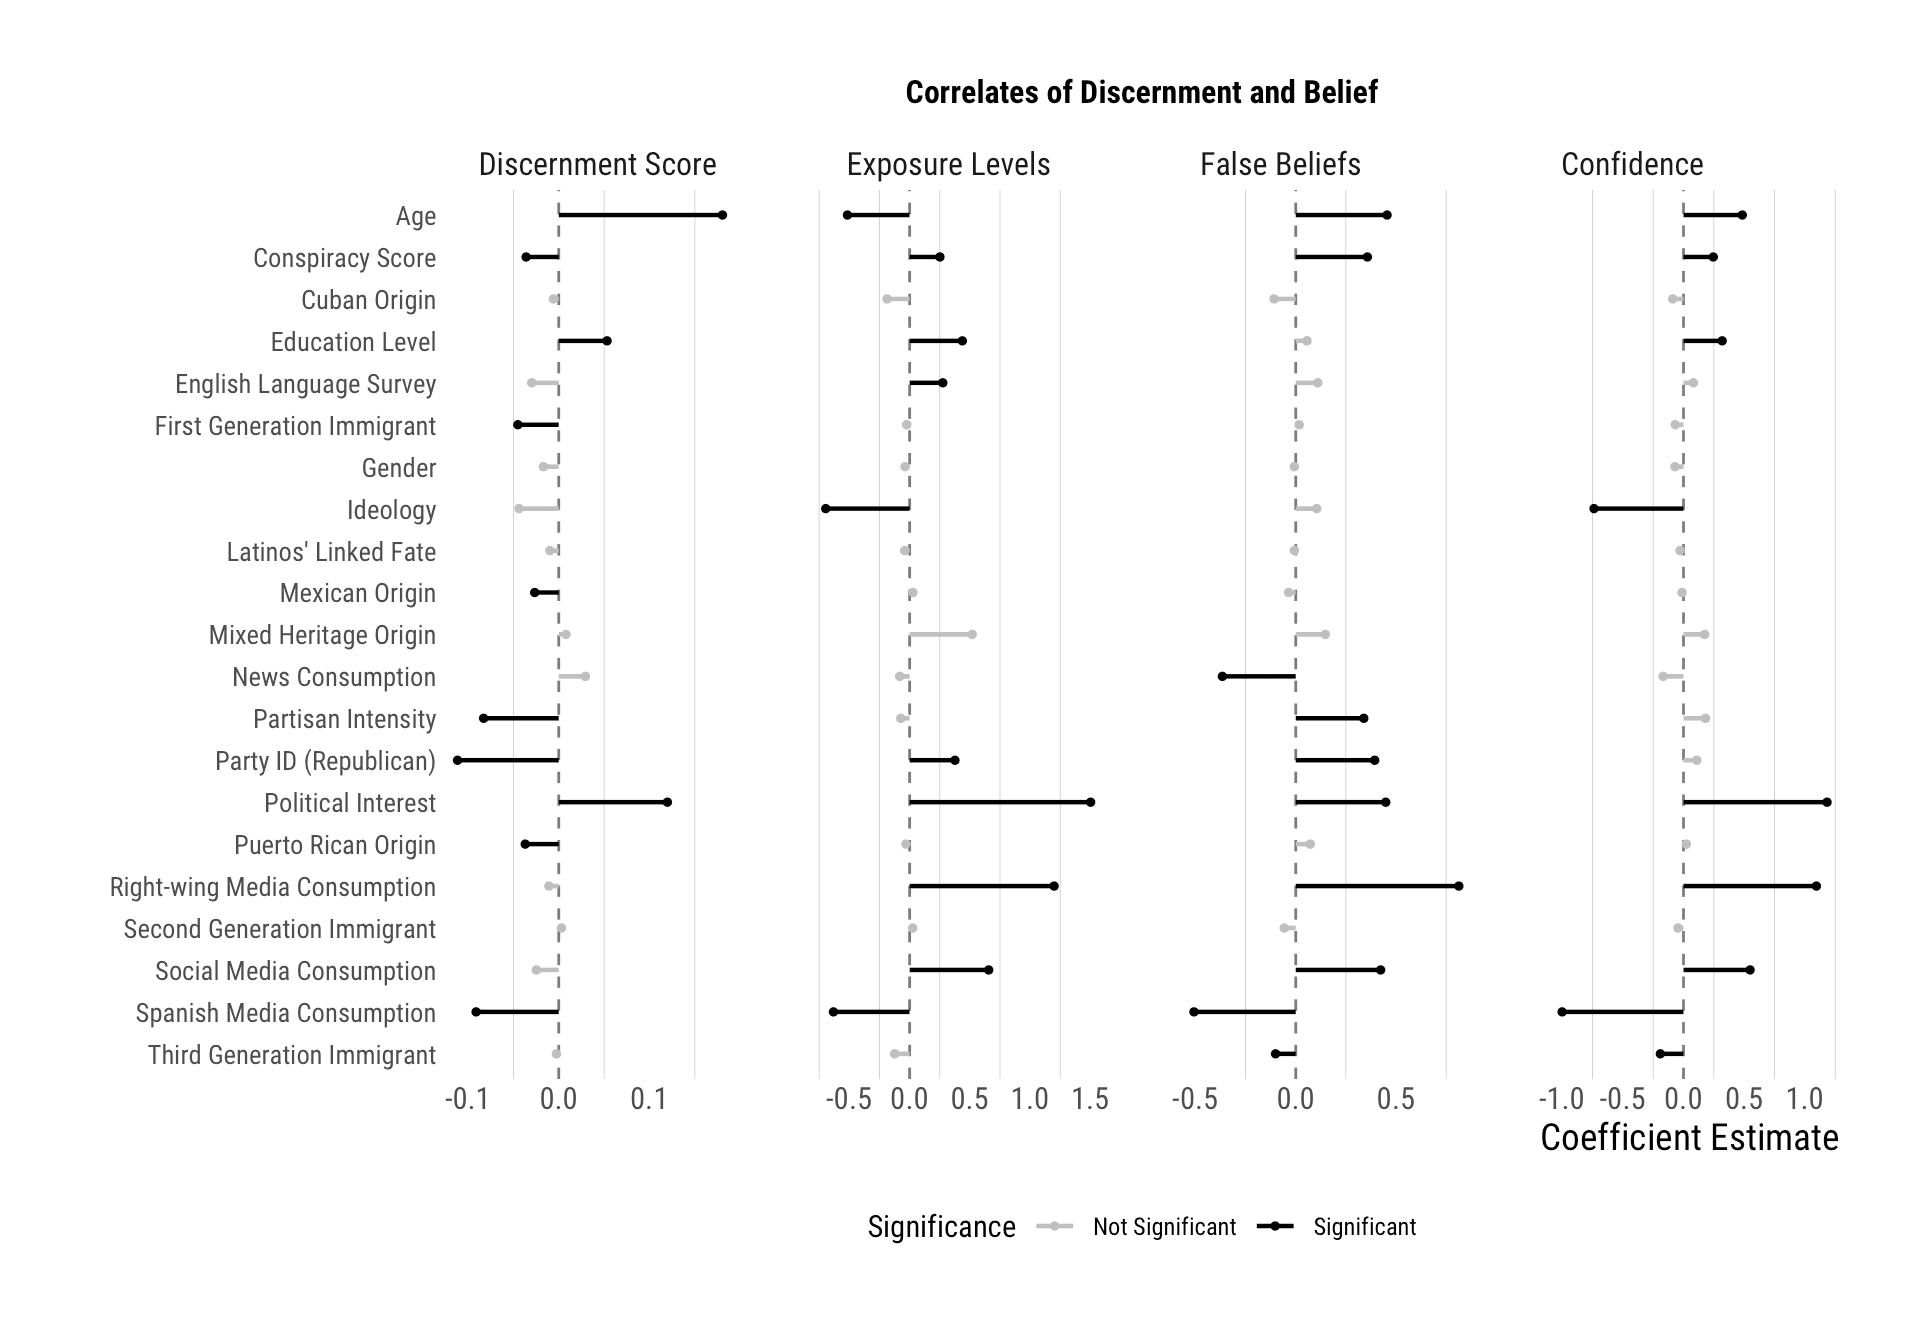
Figure 9. Scatter plot of election trust and political efficacy. The different shades of purple represent how frequently those values appear; darker purple dots show more common values. A smooth “loess” line is added to show the overall trend.
Note: Political efficacy is seen as one of the building blocks for political action. It is a concept that captures the extent to which people feel like they can have an impact on the political system. In our survey, we used a set of five items featuring questions such as “People like me don’t have any say about what the government does” and “I consider myself well-qualified to participate in politics” to calculate a measure of political efficacy. Each point represents an individual and their joint scores on the trust and efficacy scales. Among those scoring the lowest on election trust, their predicted efficacy score is 3. This is .84 points below the average efficacy score for the entire sample (3.84). However, we see a steady rise in efficacy as trust increases, with those trusting election officials the most scoring at a 5. This is 1.16 points higher than the average, and a whopping 2 points higher than those on the lower end of the election trust scale. Though not causal, the analysis suggests trust is worth examining as a factor contributing to beliefs about politicians, susceptibility to misinformation, and broader orientations toward the political system.
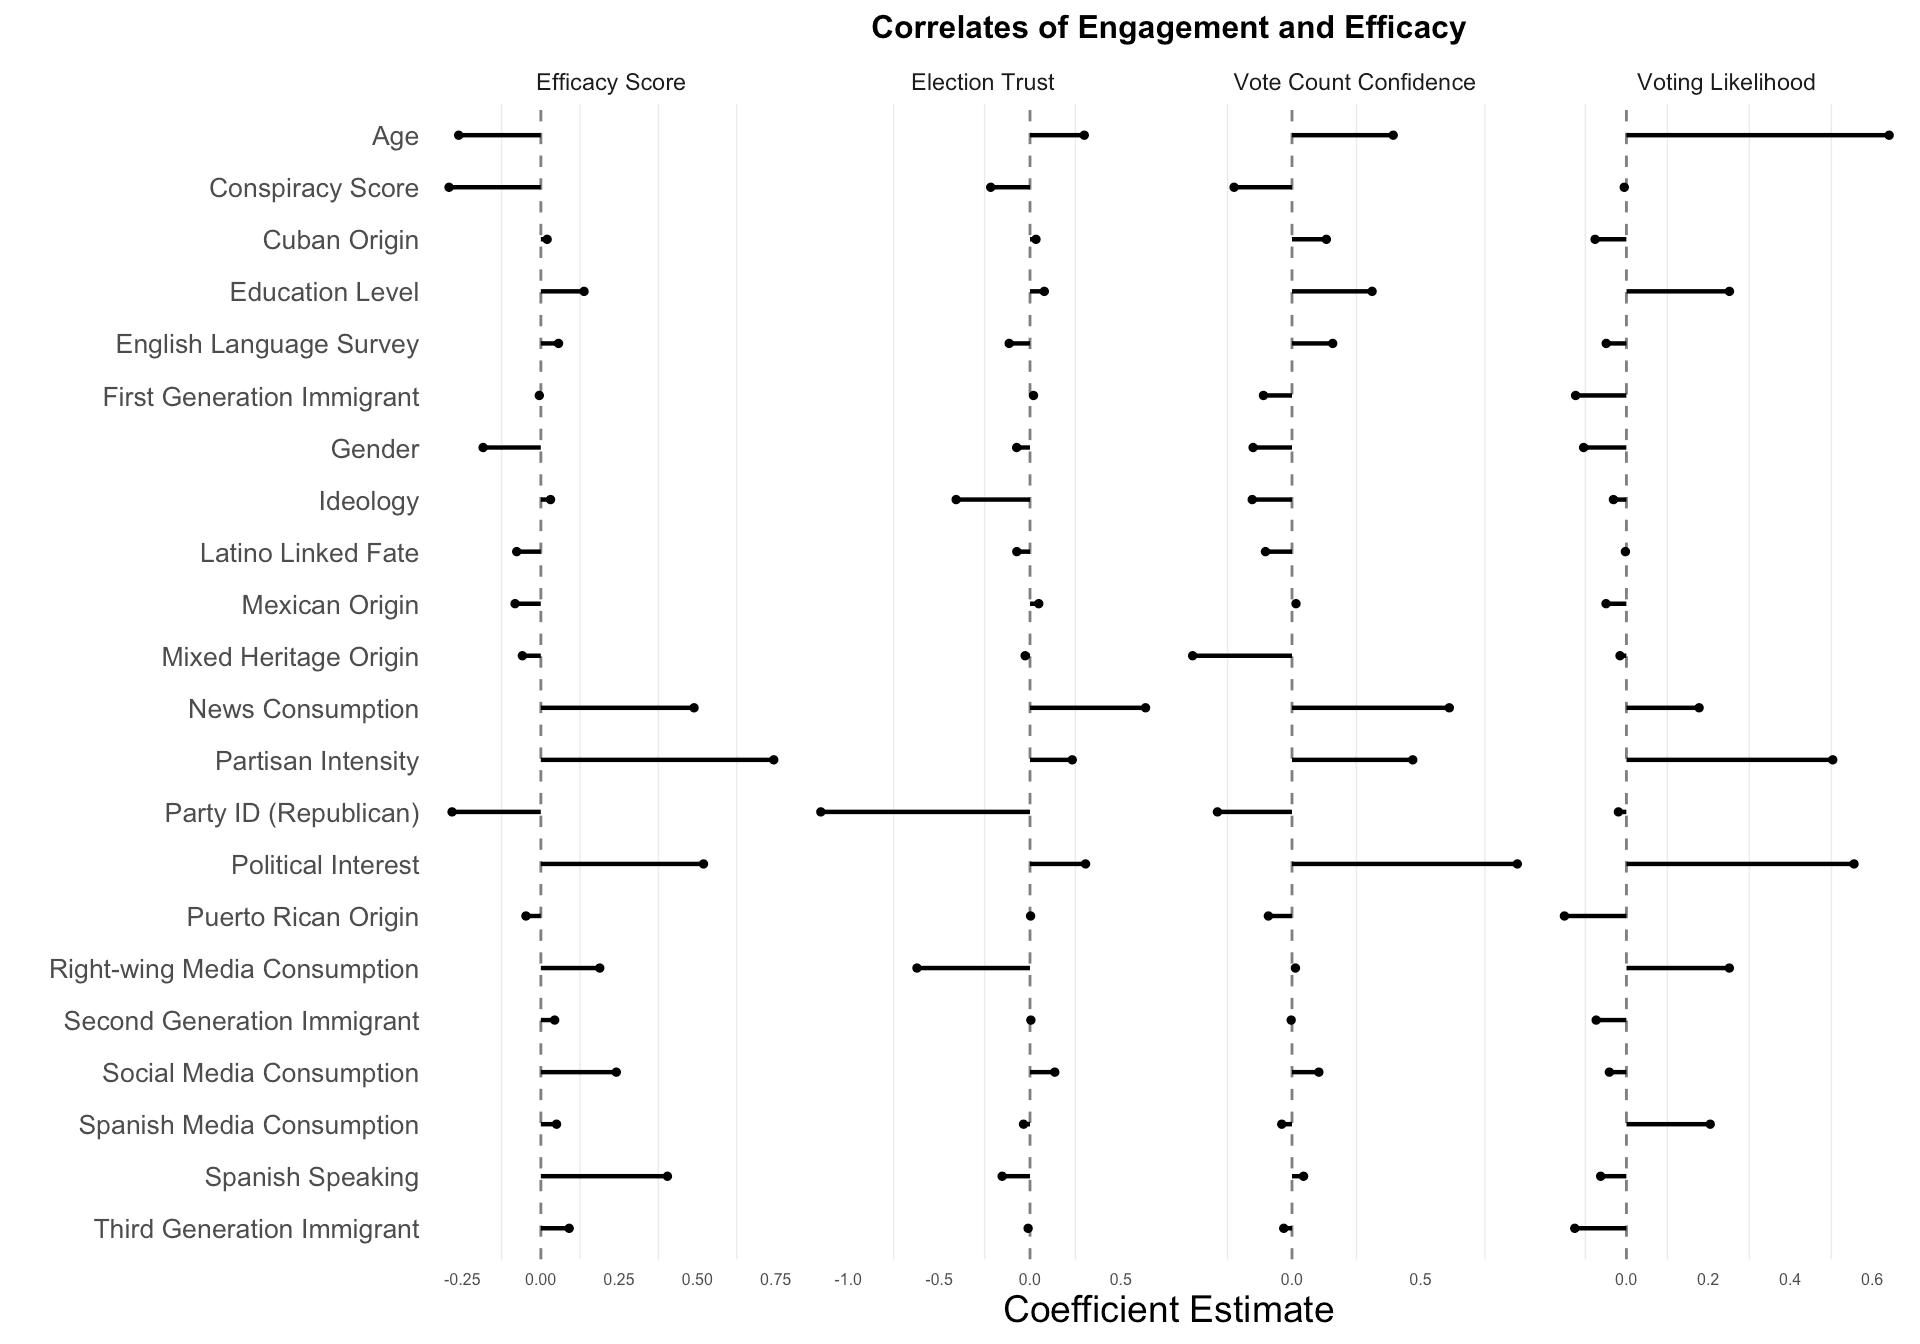
Figure 10. Standardized regression coefficients from linear regression models adjusting for all of the listed variables. Each covariate is rescaled to range from zero to one. Four separate models are estimated, regressing each outcome on the set of covariates.
DOWNLOAD LATINOS & TRUST TAKEAWAYS PDF
Download