
For additional resources about this poll, check out:
Context
In September of 2024, just a few weeks from the November 2024 U.S. elections, DDIA conducted its second foundational survey of Latinos adults in the United States. In this poll, done in partnership with YouGov, the DDIA team measured the following:
Familiarity and belief in a series of misinformation narratives and claims, including over time.
Changes in levels of trust in elections, and efficacy and vote intention since the primaries.
Agreement with new election-specific claims about Kamala Harris and Donald Trump.
Sentiments around immigration-related topics.
Updated views on generative-AI technologies and regulation.
Methodolgy
This poll was administered online with an entirely Latino sample from September 6 to September 30, 2024. 90% of respondents chose to complete the survey in English, and 10% in Spanish.
The survey had coverage of all 50 states (plus DC), with the states with the largest Latino populations (Texas, California, Florida, and New York) accounting for 59% of the sample.
Latino Democrats comprised 47% of the sample, Independents made up 24%, and Latino Republicans accounted for 29%, with the remaining respondents answering ‘unsure’.
To address sample imbalances, all analyses and descriptive statistics are weighted to population targets using vendor-provided survey weights.
As part of the survey, we tested familiarity and belief in 7 broad misinformation narratives (conspiracies or hyper-partisan frames), and 15 specific false claims (left-wing, right-wing, non-partisan, and placebo claims).
Claims - defined as a statement or assertion, often with no proof.
DDIA tested Latinos’ familiarity and belief in 16 specific false claims in September. Nine of these claims were carried over from the initial poll conducted in March/April 2024, including:
1. January 6 was a false flag operation orchestrated by the U.S. federal government and law enforcement.
2. Democrats are failing to secure the U.S. southern border in order to allow undocumented immigrants to vote for them in U.S. elections.
3. COVID-19 vaccines can lead to more serious health issues like myocarditis and infertility that would otherwise not be observed among those who catch COVID-19.
4. Giving kids vaccines can cause autism.
5. Putin warned the U.S. to stay away from the “Israel-Hamas” war.
6. The United Nations has proposed the adoption of Global Coin, a digital currency that will unify all existing currencies.
7. The Department of Education is planning to make an online activism course mandatory for students nationwide.
8. Amazon delivery drones will be supplied by the U.S. military.
9. The U.S. government is planning on selling Alaska back to Russia to pay off the national debt.
The new claims were chosen for their relevance to the 2024 election, particularly in light of events such as the Trump assassination attempt and Kamala Harris becoming the Democratic candidate.
These included:
1. Kamala Harris is a communist
2. Kamala Harris misrepresents herself as African-American
3. Republicans orchestrated the Trump assassination attempt to increase Trump’s popularity
4. The U.S. orchestrated the war in Gaza
5. Donald Trump was named on the “Epstein List” that was released
6. Artificial intelligence technologies like ChatGPT are conscious and have feelings
7. Polls are being manipulated to distort public opinion
Narratives - defined as an account of connected events; a story.
We also tested familiarity and belief in eight conspiratorial narratives. They were the following:
1. Democrats have won elections by resorting to fraud and electoral manipulation
2. Vaccines are a form of population control supported by elites and large corporations
3. There is a Deep State composed of shadowy political figures that is working against the public
4. Traditional values are being eroded by a leftist political agenda that is being implemented in schools
5. Russia is controlling American politics by undermining our elections and causing rifts between Americans
6. Corporations are all-powerful in American politics, with little room for the public to make a difference
7. Elites are plotting with mainstream media outlets and social media companies to censor the truth
8. Immigrants are destroying the American way of life
Takeaways
In early October, DDIA launched topline findings from this September poll. On the heels of the inauguration of the new president of the United States in 2025, DDIA is launching the deep dive of the 2024 findings to help foster understanding around the role misinformation played in these elections.
Uncertainty and Exposure to Misinformation Remained Stable
Latinos were familiar with misinformation narratives and claims at about the same rate in September as they were in March/April, despite an uptick in the volume of falsehoods leading up to Election Day.
Claims and narratives that had been seen by a near-majority of Latinos, such as corporations controlling politics, elites censoring the truth, Democrats failing to secure the border to increase votes, polls being manipulated, a “Deep State” existing, Democrats engaging in election fraud, and Russia controlling the U.S., were not seen by a larger percentage of participants over time, reflecting an already high saturation level. This means that, despite increasing transmission of some of these claims, a larger share of Latinos were not necessarily being exposed.
The majority of Latinos are still not subscribing to disinformation and misinformation, but a significant number expressed high levels of skepticism regarding the veracity of various claims. This high level of uncertainty can be interpreted as both a positive sign of critical thinking and a negative consequence of distrust that comes with rampant pollution on the Internet.
In our March/April poll, 62% of participants in our sample either outright reject false claims or express uncertainty about them.
In this September poll, 66% of Latinos in our sample either outright reject false claims or express uncertainty about them – a four point increase.
Belief in Conspiratorial Narratives Regarding Elites Decreased
There was a noticeable decrease from March/April to September in the number of Latinos who believed in the following narratives:
“There is a Deep State composed of shadowy political figures that is working against the public.”
“Traditional values are being eroded by a leftist political agenda that is being implemented in schools.”
“Corporations are all-powerful in American politics, with little room for the public to make a difference.”
Belief in Narratives About Russian Influence Increased
Belief in the narrative that “Russia is controlling American politics by undermining our elections and causing rifts between Americans,” increased, possibly due to headlines around Russia’s RT covertly funding U.S. influencers and new U.S. Department of Justice reporting around Russian malign influence operations.
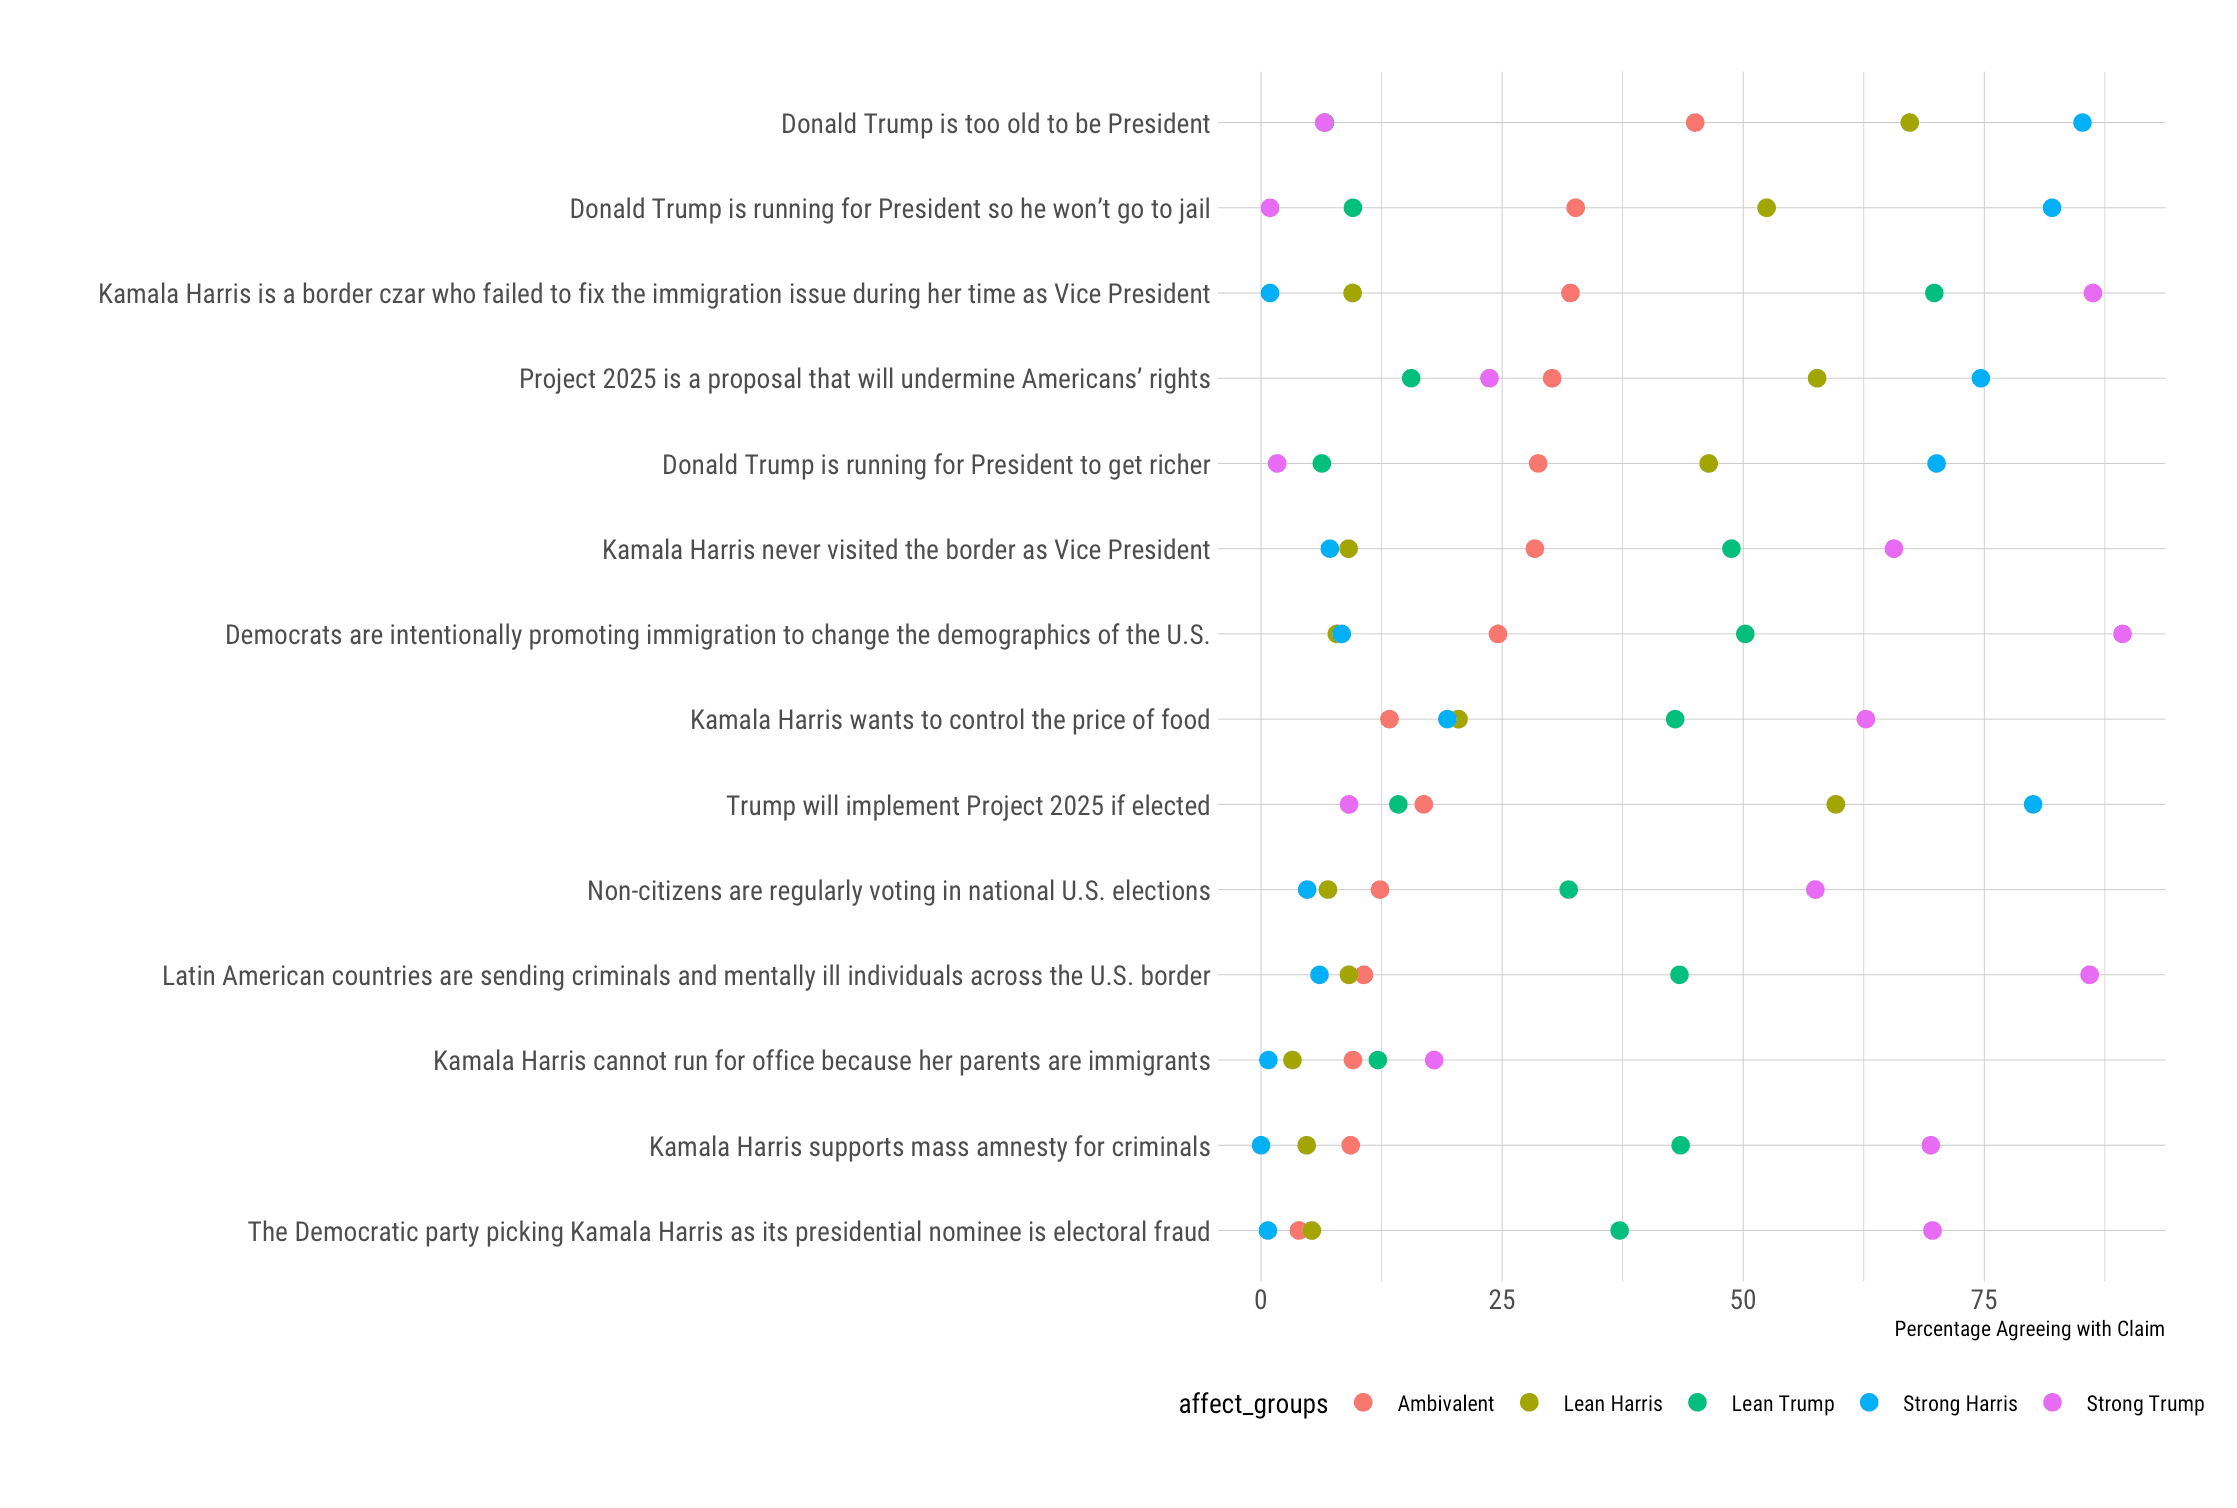
Reception of Political Narratives About Donald Trump and Kamala Harris are as follows:
On average, Latino voters were more likely to agree with claims that are less favorable to Donald Trump than they were to agree with claims attacking Harris. Between 40% and 52% of our sample agreed with claims unfavorable to Trump, whereas some anti-Harris claims were accepted by roughly 40% of Latinos in our sample. The Trump-related claims included:
“Donald Trump is too old to be President.” (52% agreeing in our sample)
“Donald Trump is running for President to get richer.” (41% agreeing in our sample)
“Donald Trump is running for President so he won’t go to jail.” (44% agreeing in our sample)
Despite this, certain claims targeting Kamala Harris have also gained traction among Latinos, with roughly one-third agreeing with the following statements regarding her handling of the border and accusations of price fixing:
“Kamala Harris wants to control the price of food.” (37% agreeing in our sample)
“Kamala Harris is a border czar who failed to fix the issue of immigration during her time as Vice President.” (41% agreeing in our sample)
The false narrative that “Latin American countries are sending criminals and mentally ill individuals across the U.S. border,” was accepted by 33% of Latinos in our sample.
More persuadable Latino voters saw some truth in claims about Kamala Harris mishandling the U.S.-Mexico border while simultaneously having concerns about Donald Trump’s motivations for running for office.
Latino voters who rate Trump and Harris equally on a 0-100 “Feeling Thermometer” (they feel ambivalent about both), tended to align with Trump supporters on border-related claims about Harris mishandling immigration, but sided with Harris supporters regarding criticisms of Trump’s motivations for running for office, including that he is too old to run, that he is running to stay out of jail, and and that he is running to get richer.
Trust in Some Democratic Institutions and Stakeholders Increased
One of the most positive developments observed in this DDIA poll was a broad increase in trust across various election-related actors.
Confidence in secretaries of state and election administrators saw modest improvements (by about 3-4 points), with Latinos in our sample being more likely to believe that these officials will act appropriately on Election Day. We also saw modest gains in trust towards Democrats to “do the right thing” during the election from 41% to 45%, while trust toward Republicans to “do the right thing” stayed at around 31%.
Attitudes Toward Immigration Were Complex:
DDIA measured agreement and disagreement with ten immigration-related statements.
Our findings indicate strong positive attitudes among U.S. Latinos toward immigrants in general, with high levels of agreement among Latinos we polled that “immigrants positively contribute to American communities” and that “immigrants improve America by bringing new ideas and cultures.”
This perspective likely aligns with many Latinos’ personal experiences and family histories, reinforcing the value they see in America’s immigrant tradition.
BUT, when it comes to unauthorized immigration, beliefs become more complex. Nearly half of Latino survey respondents agree that “Increased illegal immigration brings increased crime” (47% agree) and that “immigrants can be a drain on local resources” (44% agree). That said, Latinos mostly reject the statement that “immigrants take jobs away from people who were born in the United States” (52% disagree).
Despite increasing misinformation about non-citizen voting as we approach the election, we are not seeing an uptick in beliefs related to the topic. Across the two polls, we find that similar numbers of Latinos accept claims that Democrats are failing to secure the border for electoral gain and narratives that Democrats are engaging in electoral fraud.
Just slightly over 40% of those who had seen “Democrats are failing to secure the U.S. southern border in order to allow undocumented immigrants to vote for them in U.S. elections” accepted the claim in both of our surveys. These estimates stayed pretty similar across waves (41% in our March/April poll; 40% in our September poll).
Roughly 35% exposed to the narrative that “Democrats have won elections by resorting to fraud and electoral manipulation” accepted this narrative in both surveys, with no discernible increase in these beliefs.
This split highlights the nuanced views within the Latino community regarding different aspects of immigration, suggesting that simplistic messaging on this issue may not resonate effectively with many Latino voters.
Use of AI Increased, But Many Latinos Remain Concerned About Its Impacts On Their Lives:
Adoption of AI tools remains modest but is increasing; regular ChatGPT users rose from 15% in March/April to 20% in September.
Trust in the accuracy of AI output among users seems to be growing, from 60% in March/April to 66% in September.
Yet while many Latinos are hopeful about AI's potential—for example, 56% believe it can enable medical discoveries and 44% see it as a tool to enhance productivity—concerns about its economic impacts are far more prevalent, with 66% agreeing that AI will “take jobs away from ordinary people.”
Policy preferences reflect this caution, as 69% in September (Wave 2) agreed on the urgent need for AI regulation, compared to 68% in March/April (Wave 1).
Exposure, Belief, and Uncertainty in Claims and Narratives
Claims
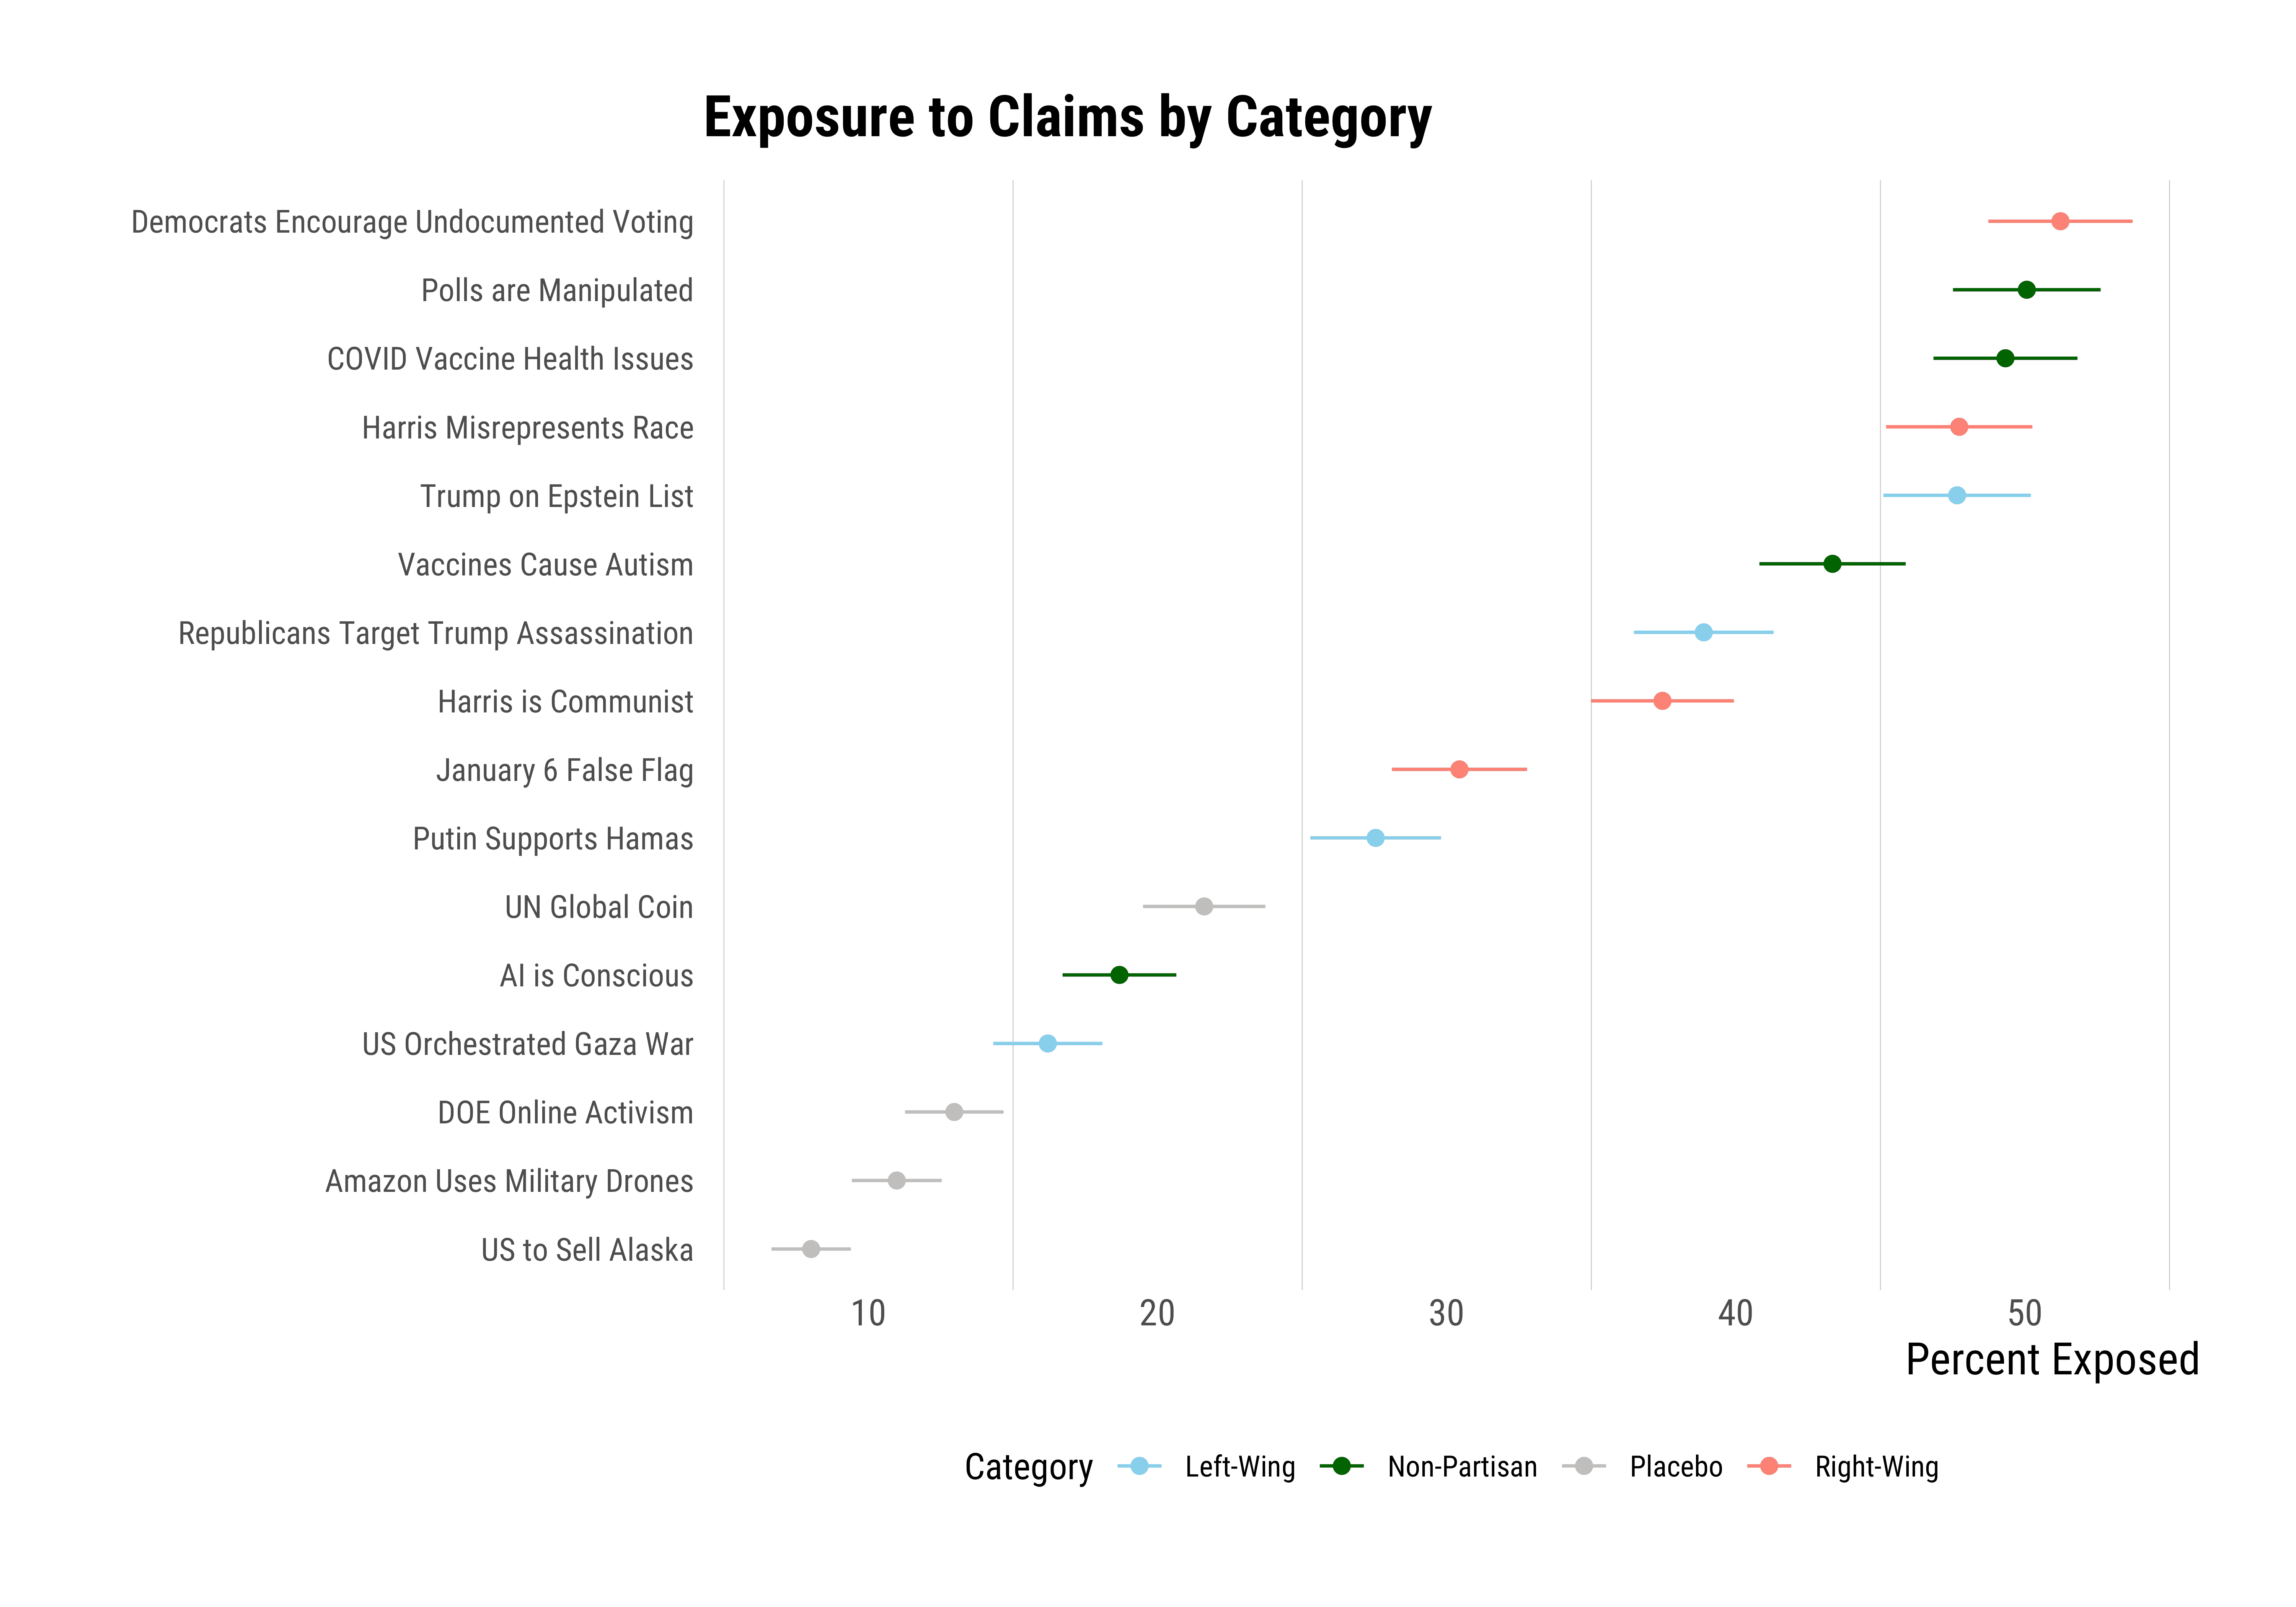
Rates of Exposure/Familiarity to Claims:
Our findings revealed three distinct tiers of exposure among these claims: high, medium, and low.
The high exposure category consisted of claims that were familiar to a significant portion of our sample. These included statements about Democrats keeping the border open to let in undocumented migrants in to vote for them, polls being manipulated, Covid-19 vaccines creating health issues, and Kamala Harris misrepresenting her race. The high recognition of these claims can likely be attributed to their prominence during the election cycle or their long-standing presence in American political discourse.
The medium exposure tier encompassed claims that were recognized by 30% to 45% of respondents. These included assertions about Putin supporting Hamas, the January 6 event being a false flag operation, and Kamala Harris being a communist.
In the low exposure category, we found that placebo claims, as could be predicted, were seen by less than 25% of our sample, consistent with our previous polls.
Narratives
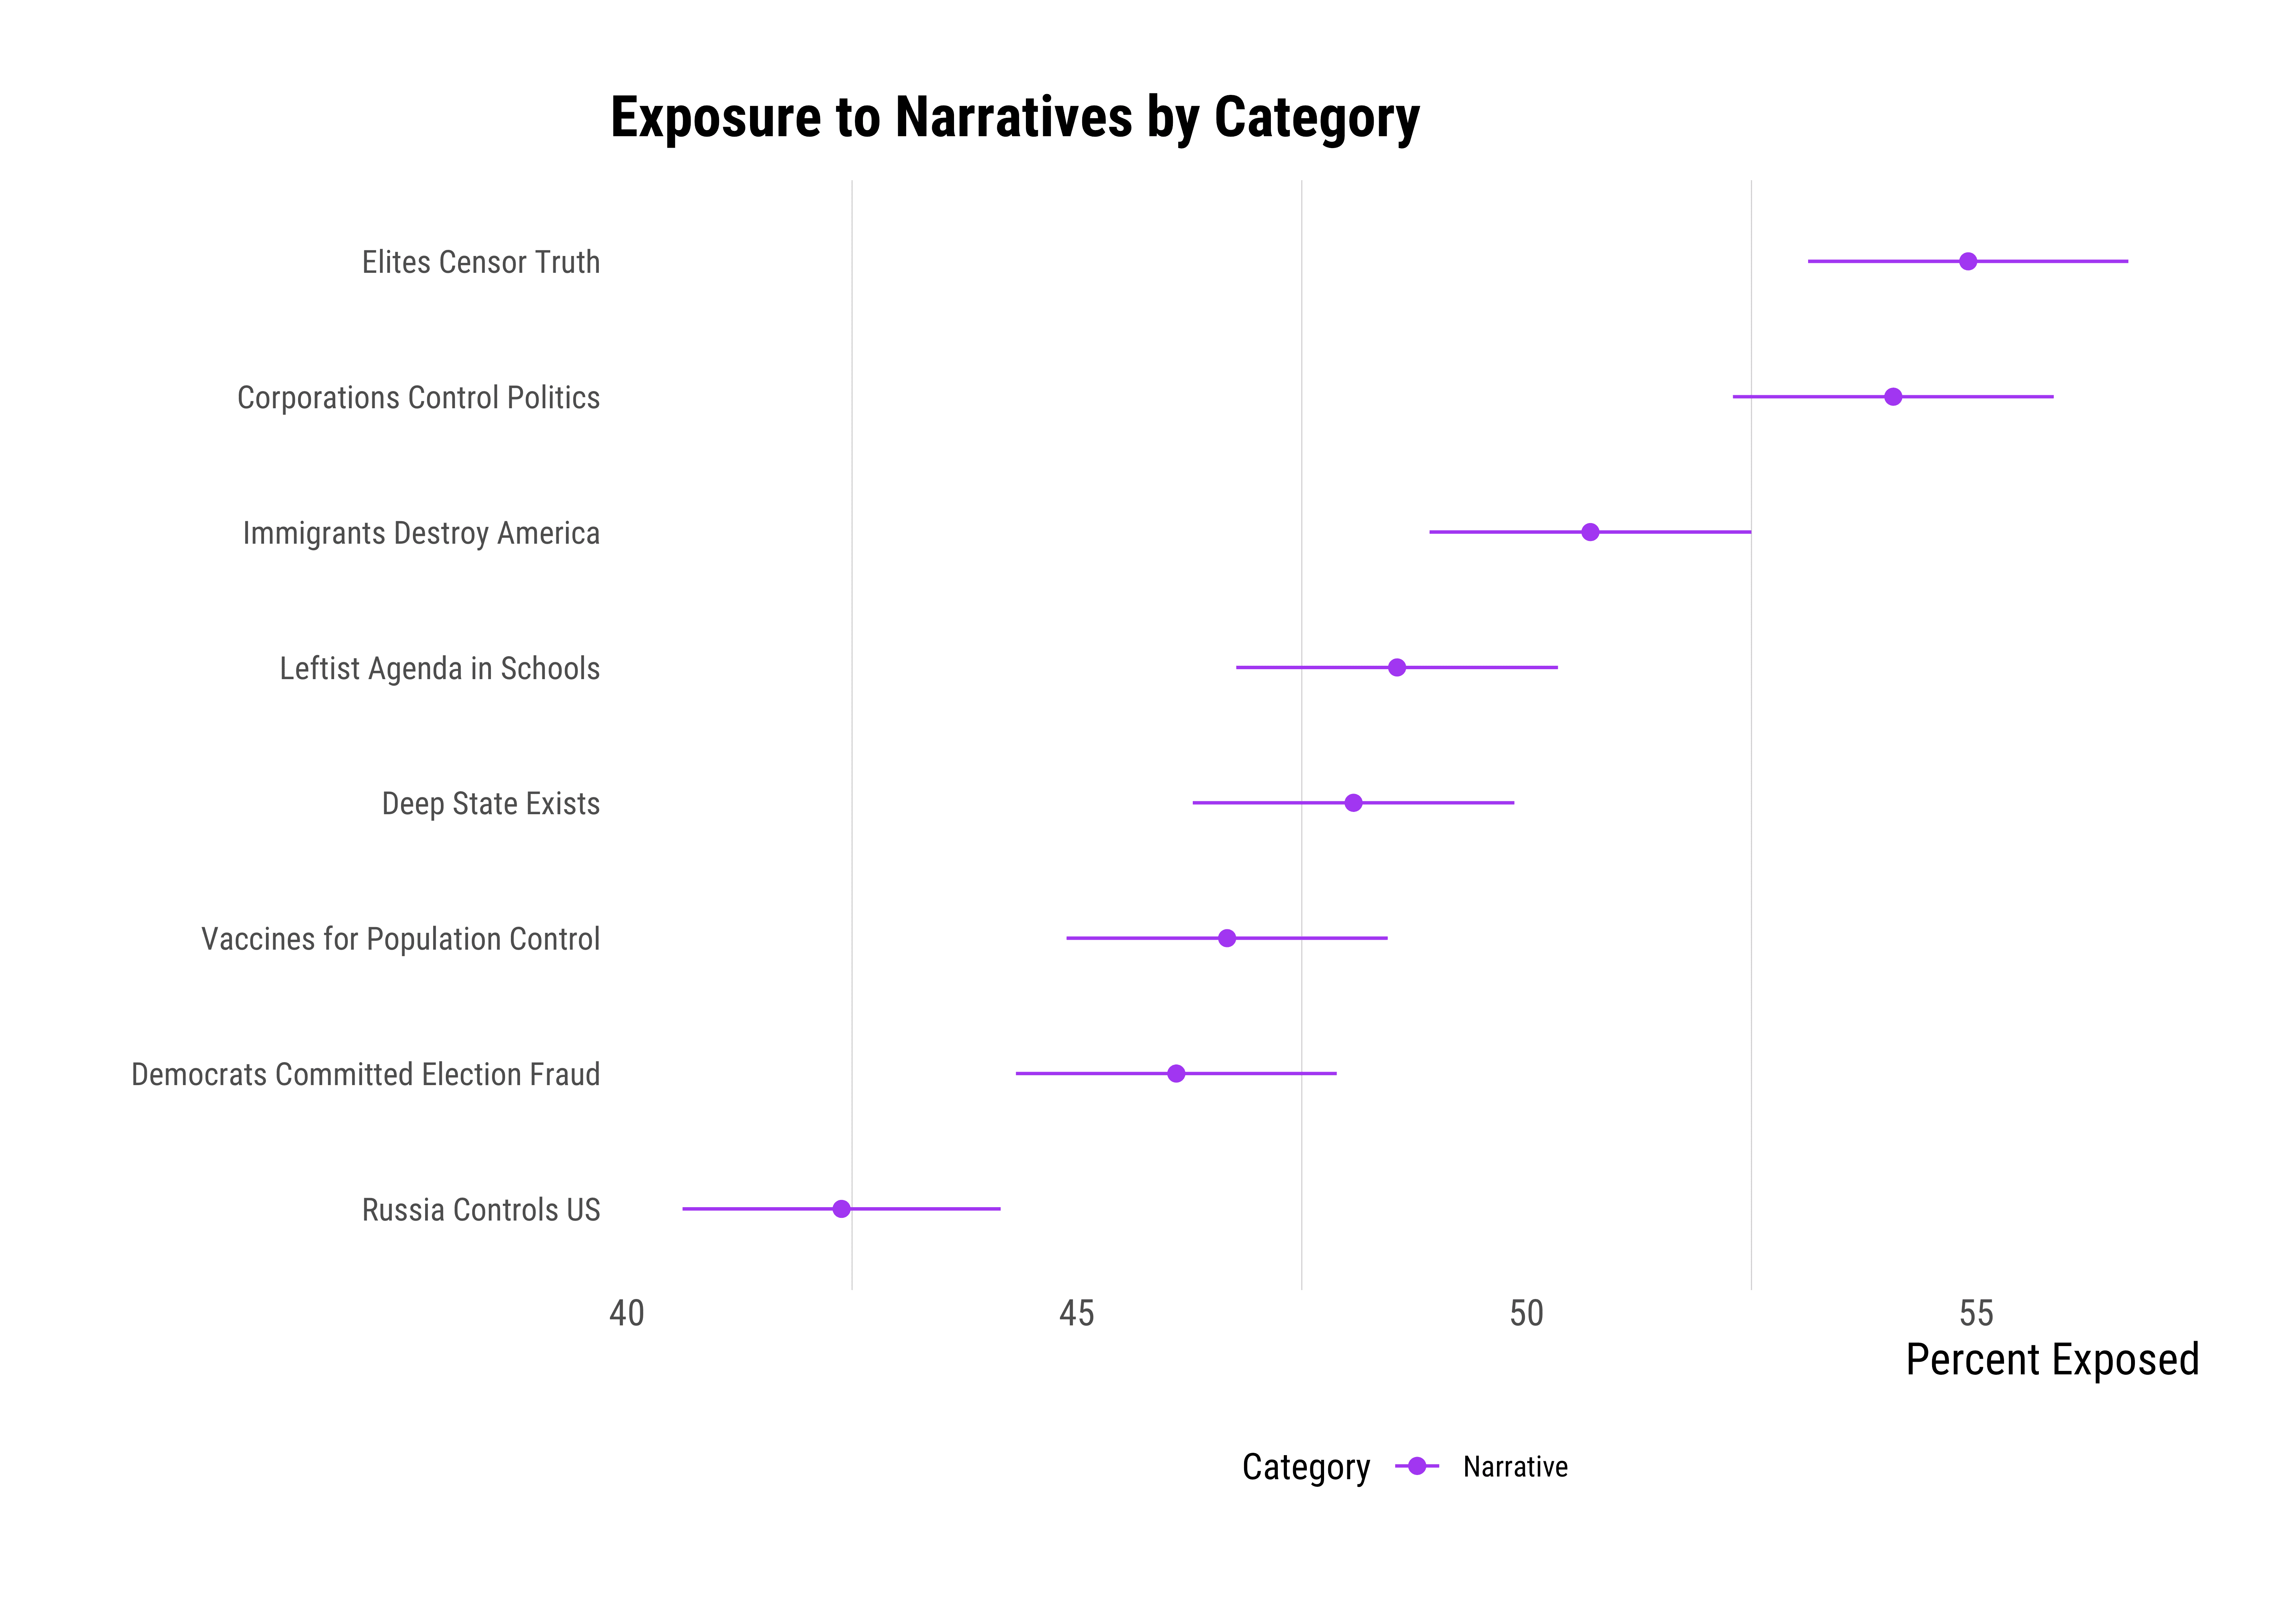
Rates of Exposure/Familiarity to Narratives:
Turning our attention to narratives, DDIA observed a striking contrast in exposure rates compared to specific claims. Narratives appear to have a much wider reach among Latinos in our sample. The most prevalent narratives, each seen by just under 55% of respondents, are that “elites censor the truth” and “corporations control politics.”
Several other narratives also achieved near-majority exposure rates. These include beliefs that there is a “leftist agenda in schools,” that “a deep state exists,” that “vaccines are used for population control,” and that “Democrats committed election fraud.” Each of these narratives was encountered by close to half of our sample.
Even the least-seen narrative in our study, “Russia controls the US,” still reached a substantial portion of the Latino population. Approximately 42% of respondents reported having encountered this narrative, highlighting the pervasive nature of these broader, more abstract beliefs compared to specific claims.
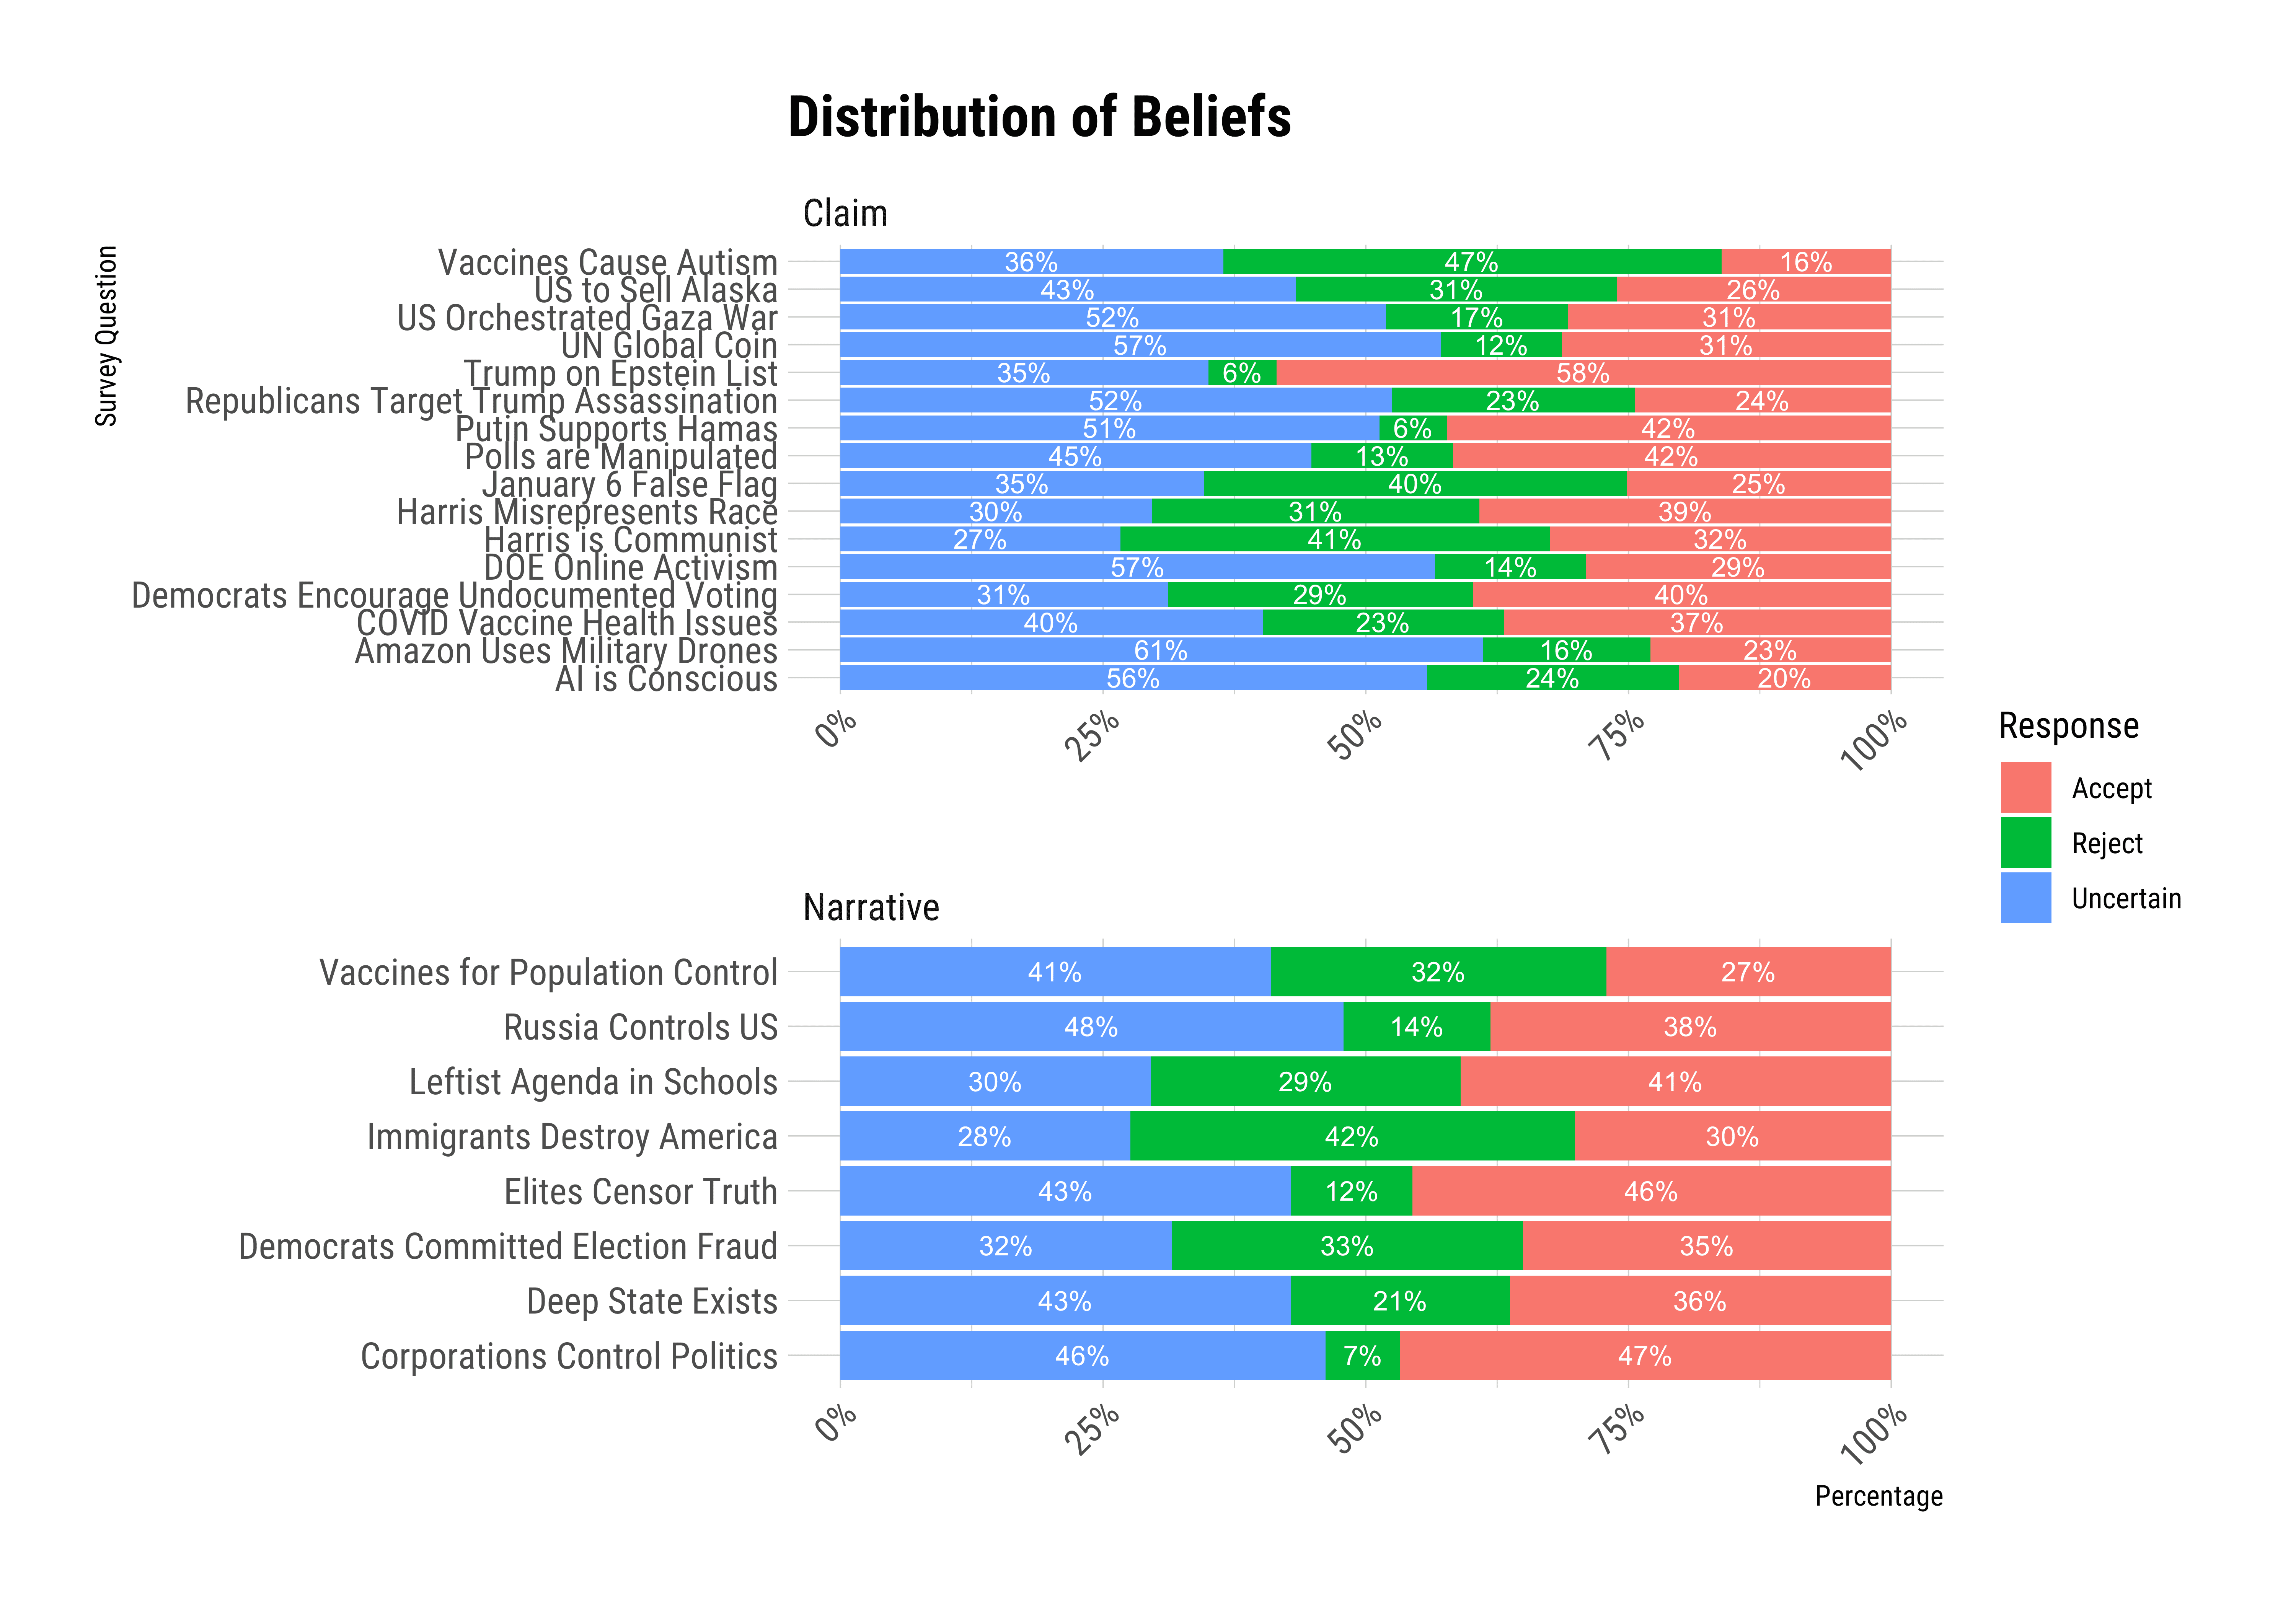
Beliefs in Claims and Narratives Among the Exposed
Our analysis of beliefs among exposed Latinos reveals significant variation across different claims. The claim with the highest acceptance rate is that Trump was on Epstein’s list, with 58% of exposed Latinos accepting it. Several other claims also received relatively high levels of acceptance among the exposed, including:
Putin supporting Hamas (42%)
Polls being manipulated (42%)
Democrats leaving the border open to let in undocumented migrants to vote for them (40%)
Harris misrepresenting her race (39%)
Covid vaccine producing health issues (37%)
However, it’s important to note that uncertainty and rejection of claims generally outweigh acceptance. In fact, only in the case of Trump being on Epstein’s list did the number of those accepting the claim surpass the combined number of those uncertain or rejecting it.
For 7 out of the 16 claims, uncertainty was the most common response. Moreover, for claims such as January 6 being a false flag operation, Harris being a communist, and vaccines causing autism, rejection was the most prevalent response. These findings align with our previous research, confirming that among Latinos, uncertainty and rejection of false claims are far more common than acceptance.
Regarding narratives, we observed that the most accepted claims among exposed Latinos were:
Corporations controlling politics (47%)
Elites censoring truth (46%)
Other narratives also received notable levels of acceptance, including:
A leftist agenda in schools (41%)
Russia controlling the US (38%)
The existence of a Deep State (36%)
Democrats committing election fraud (35%)
However, even with these broader narratives, uncertainty remains high. For several claims - including Russia controlling the US, vaccines being used for population control, elites censoring the truth, the existence of a Deep State, and corporations controlling politics - just over 40% of exposed Latinos expressed uncertainty about their validity. This underscores the prevalence of doubt even when confronted with these more general narrative claims.
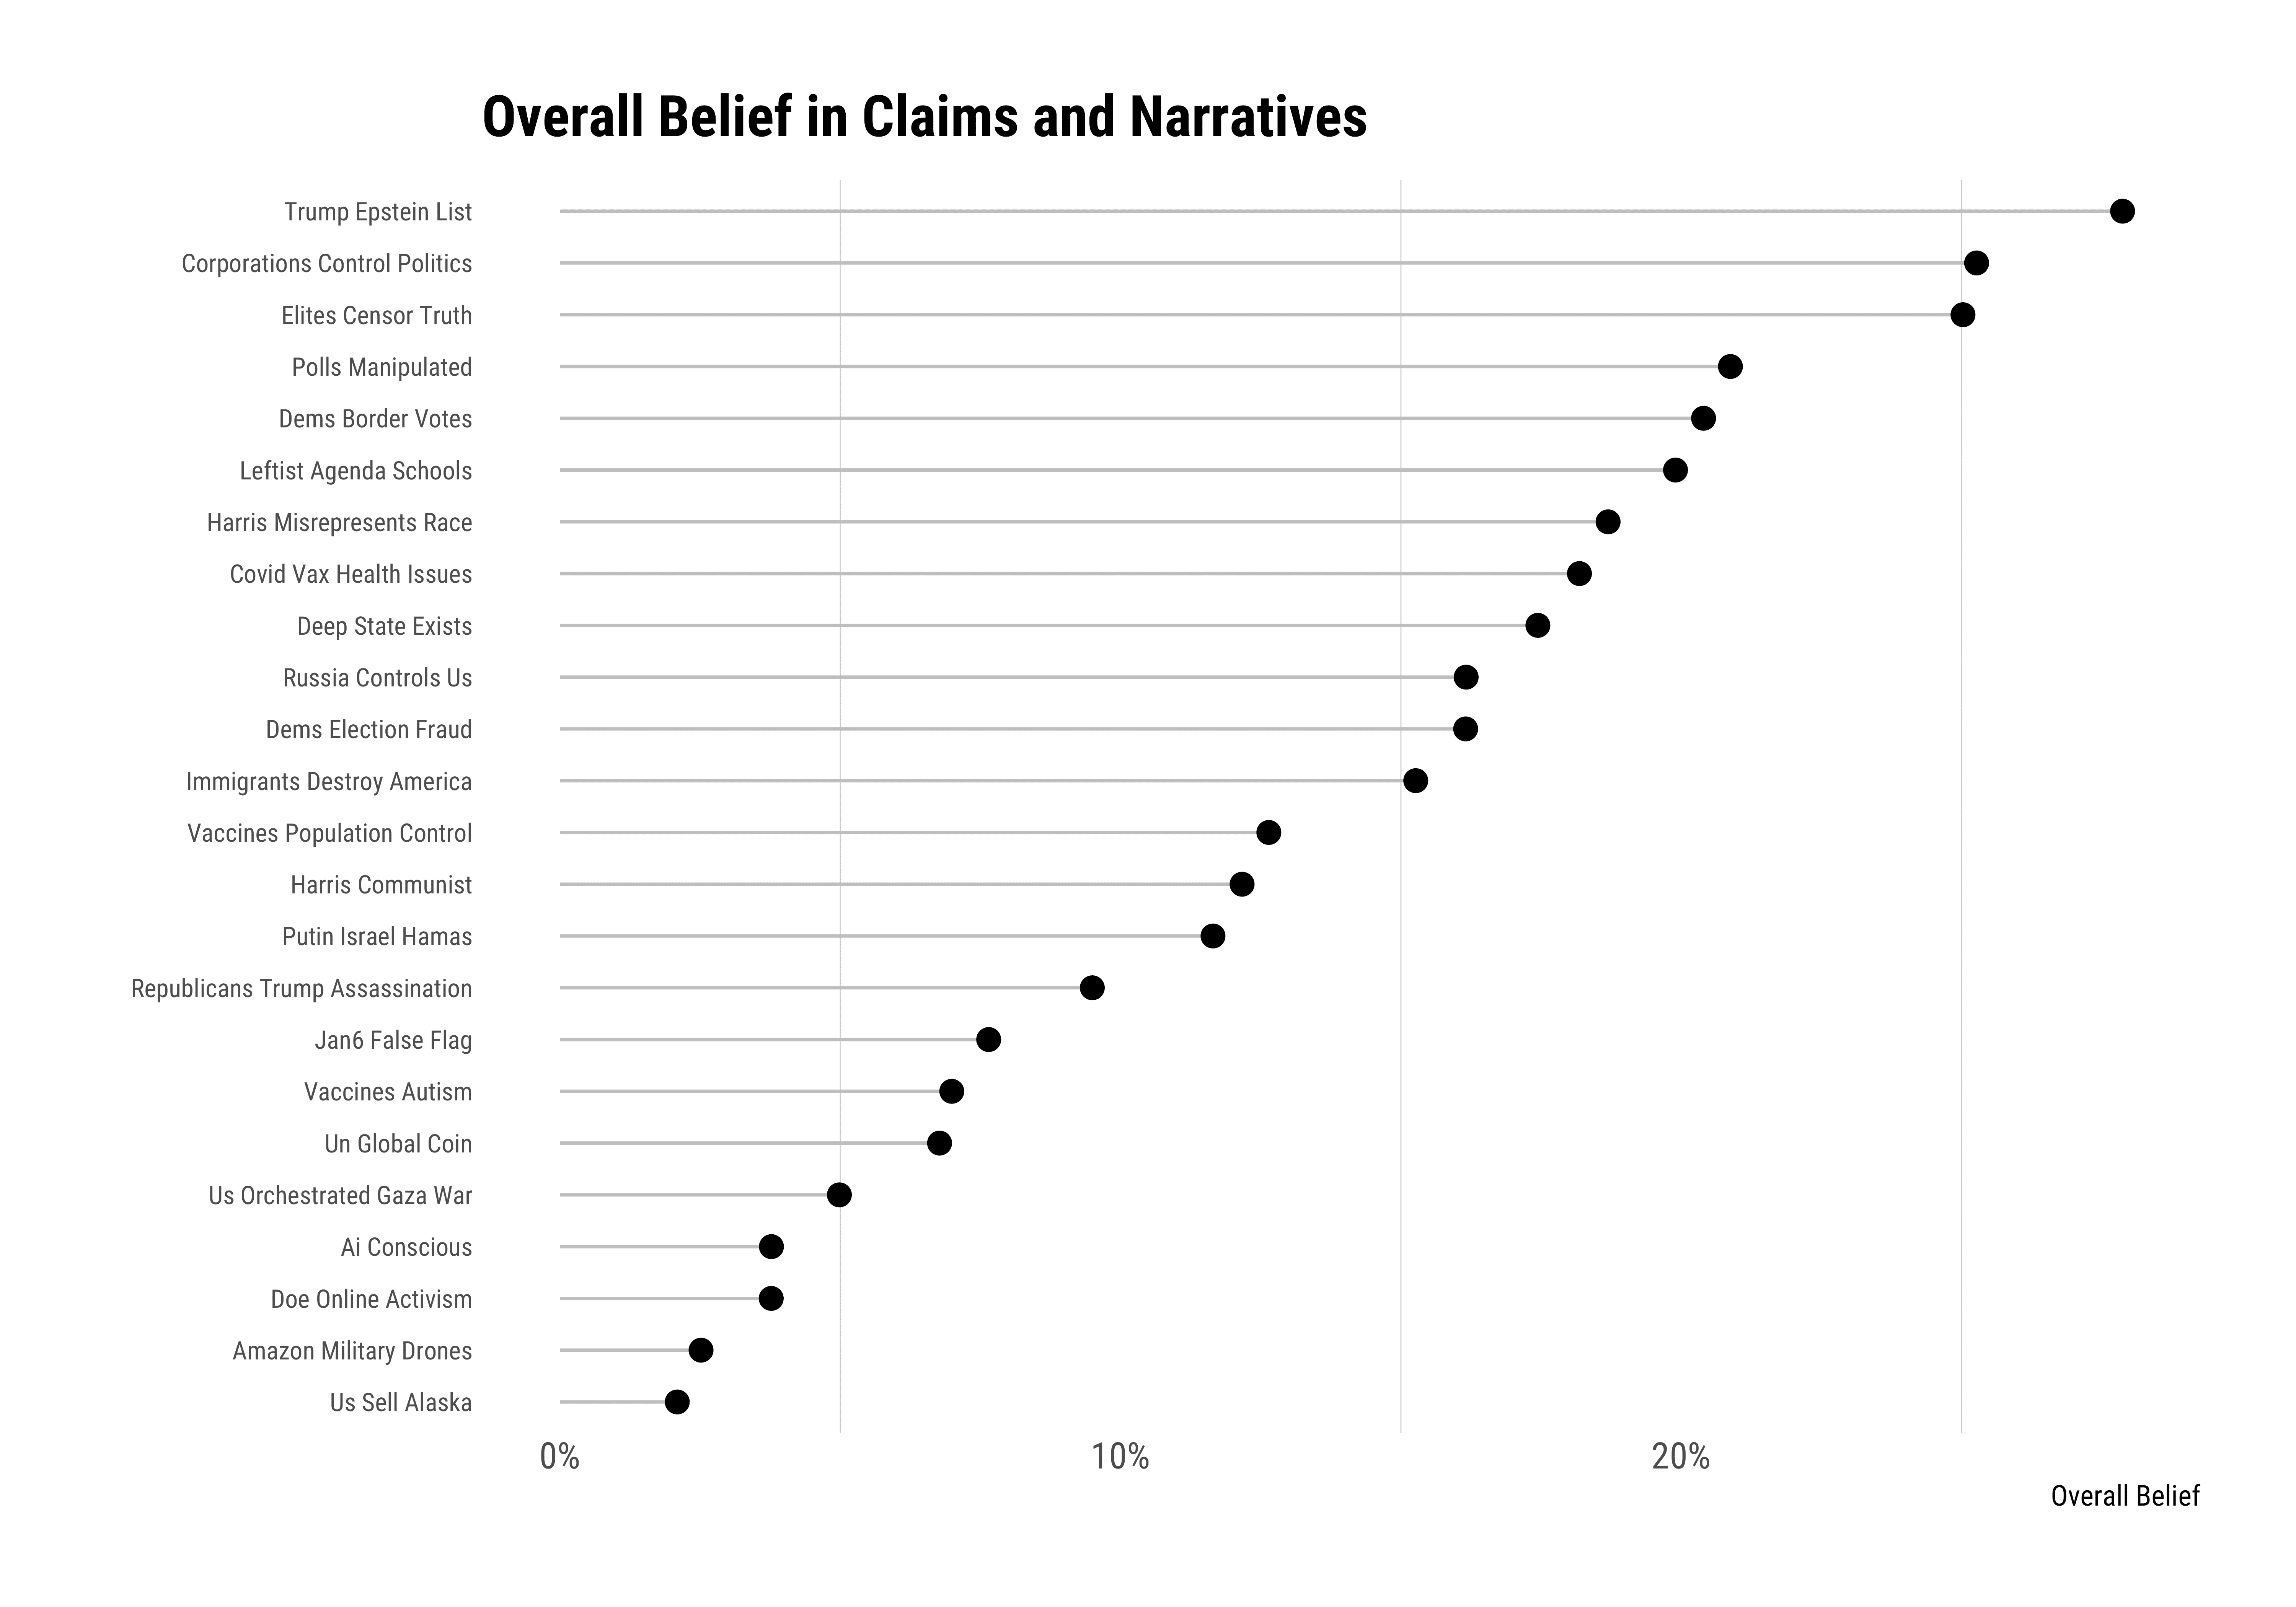
Overall Misinformation Acceptance Rates
The claim with the highest overall belief rate is “Trump being on Epstein’s list” at approximately 28%. Close behind are two broad narratives: “Corporations control politics” and “Elites censor truth,” both around 25% overall acceptance in our sample.
A second tier of claims and narratives achieved overall belief rates between 18-21%. These include high-exposure items such as “Polls are manipulated” (21%), “Democrats encourage undocumented voting” (20%), “Leftist agenda in schools” (20%), and “Harris misrepresents her race” (19%). Their relatively high overall belief rates seem to result from both substantial exposure and moderate-to-high acceptance rates among those exposed.
As expected, many placebo claims show low overall belief rates. Items like “US to sell Alaska” (2%), “Amazon uses military drones” (3%), and “DOE online activism” (4%) had minimal traction, primarily due to the fact that they were constructed by the research team to serve as a benchmark for separating genuine beliefs from beliefs developed on the fly while taking the survey. However, some substantive claims also showed low overall belief, such as “US orchestrated Gaza war” (5%) and “January 6 was a false flag” (8%), suggesting these claims gained less traction in the Latino community.
Interestingly, claims and narratives related to vaccines showed varied estimates. While “COVID vaccine health issues” achieved a moderately high overall belief rate (18%), more extreme items like “Vaccines cause autism” (7%) and “Vaccines are used for population control” (13%) showed substantially lower rates. This suggests that Latinos may be more receptive to health-related concerns about specific vaccines than to broader conspiracy theories about vaccination.
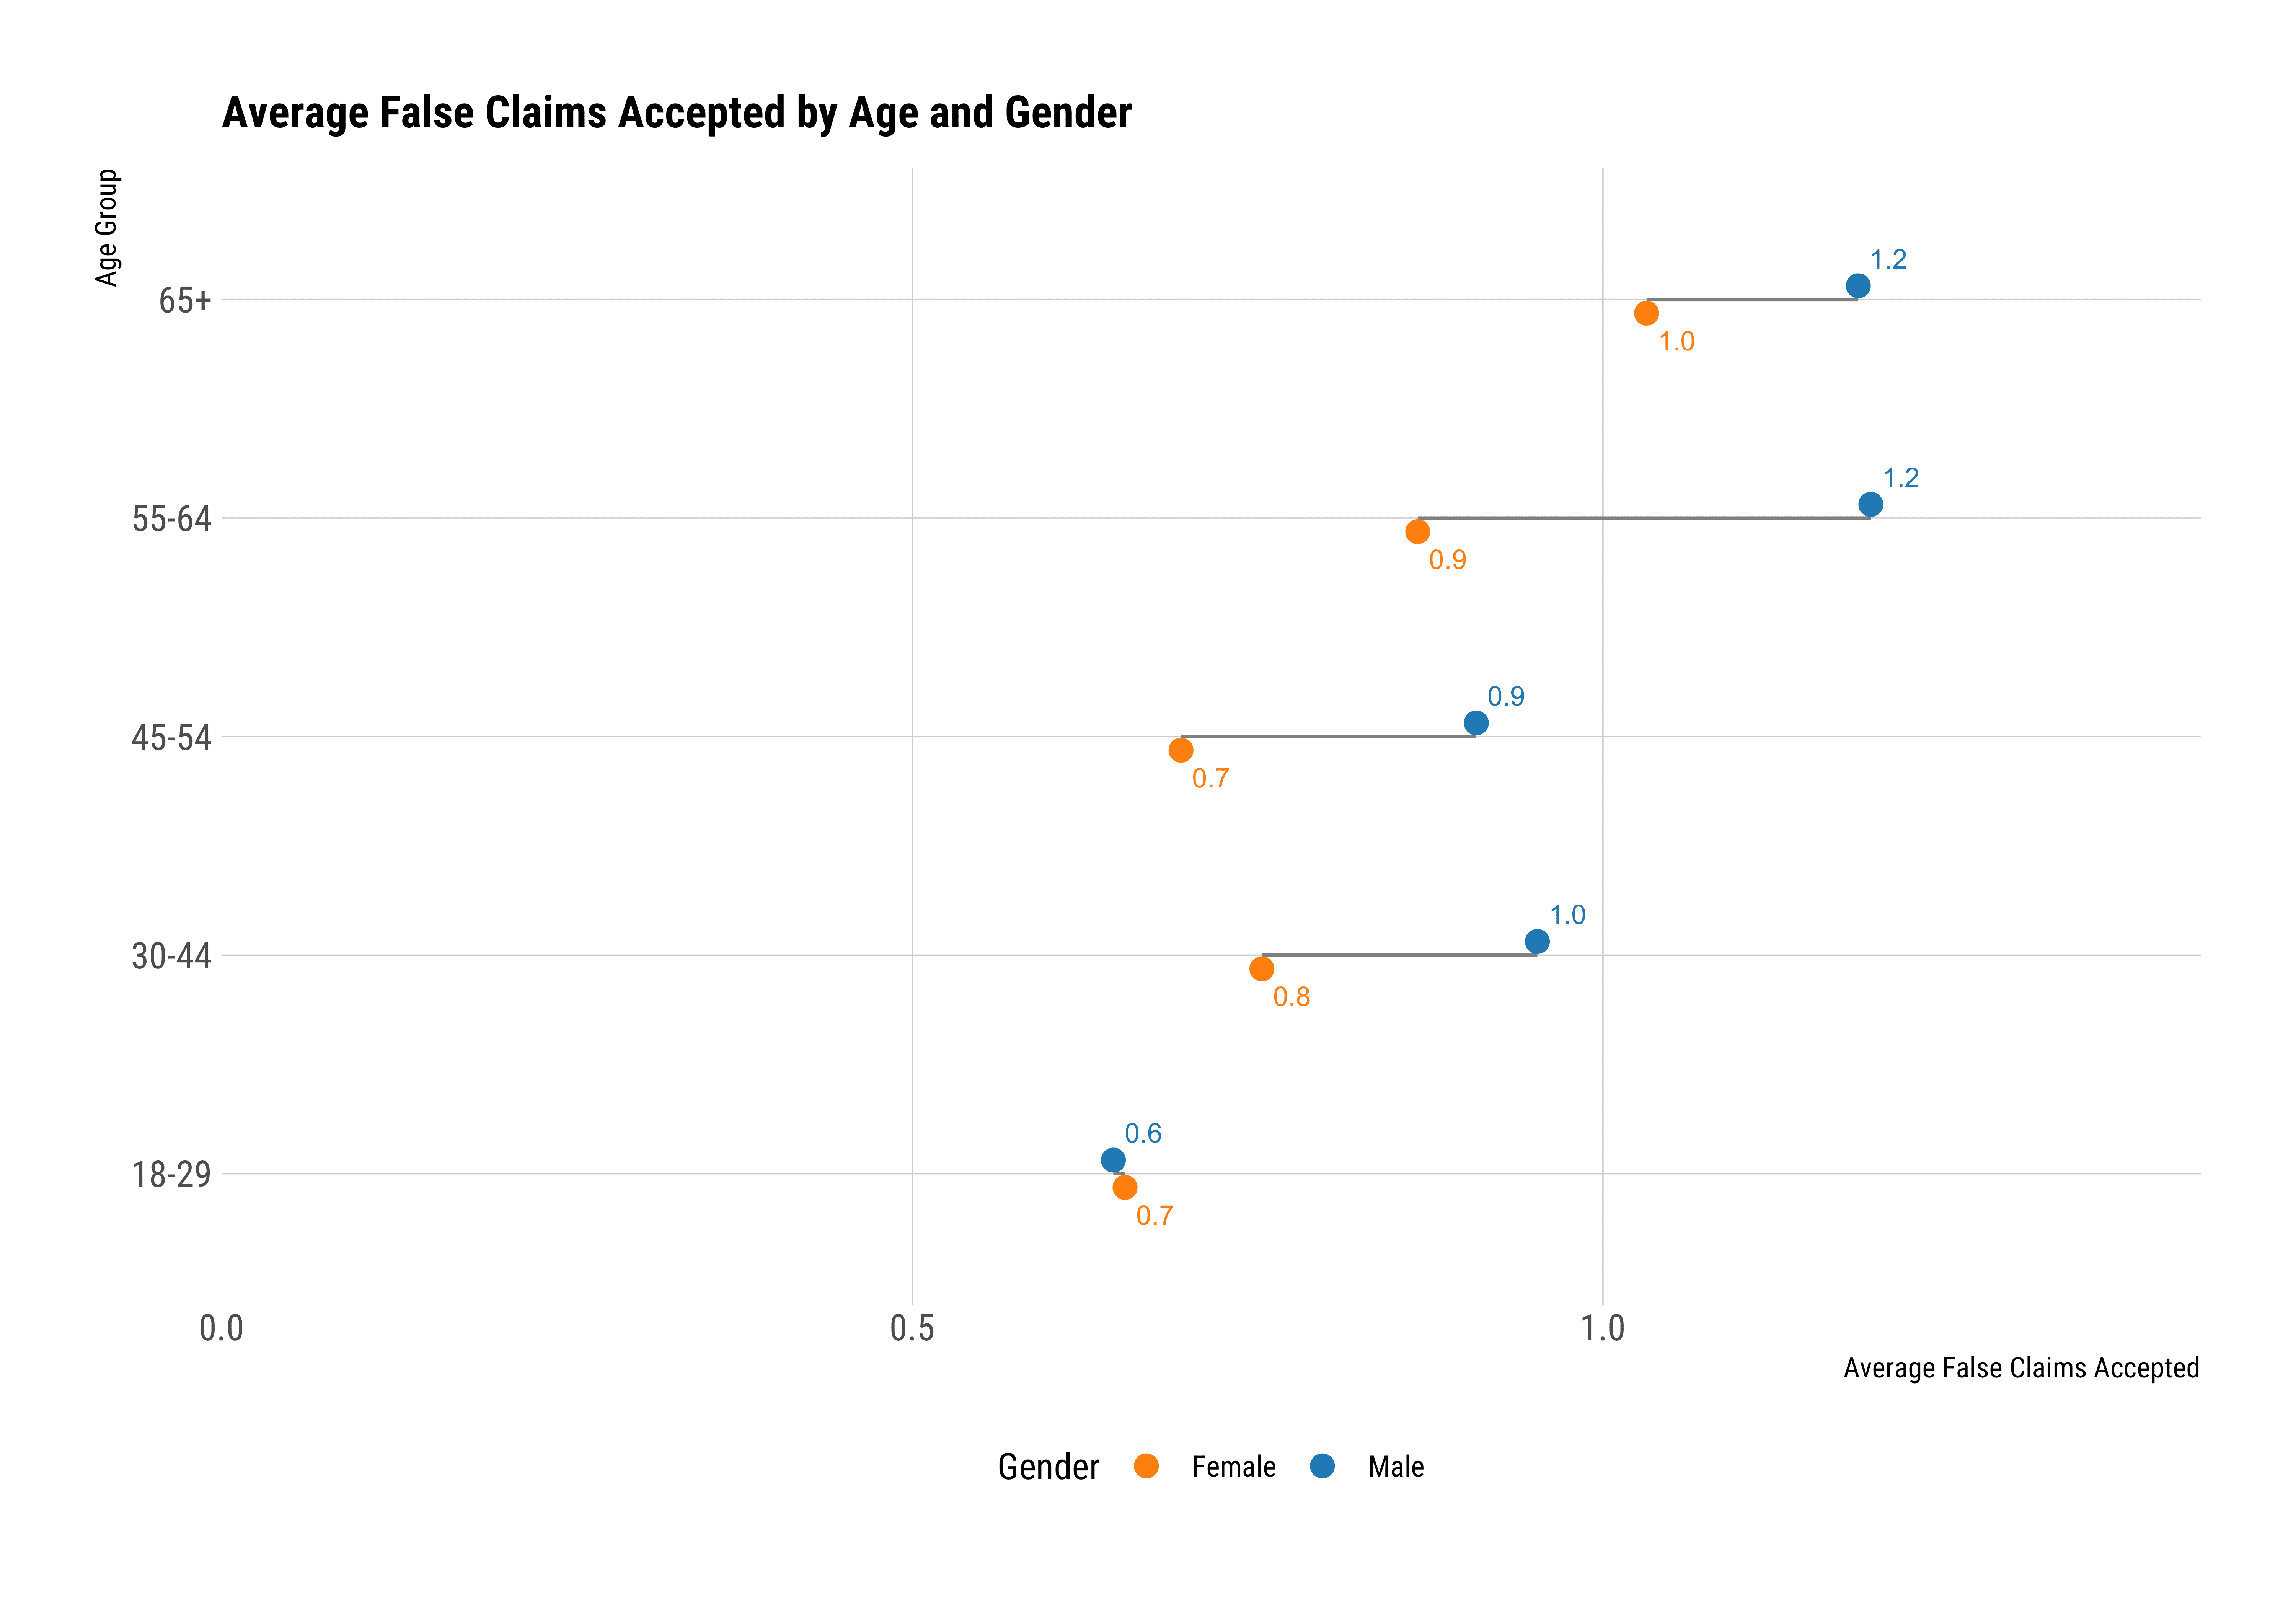
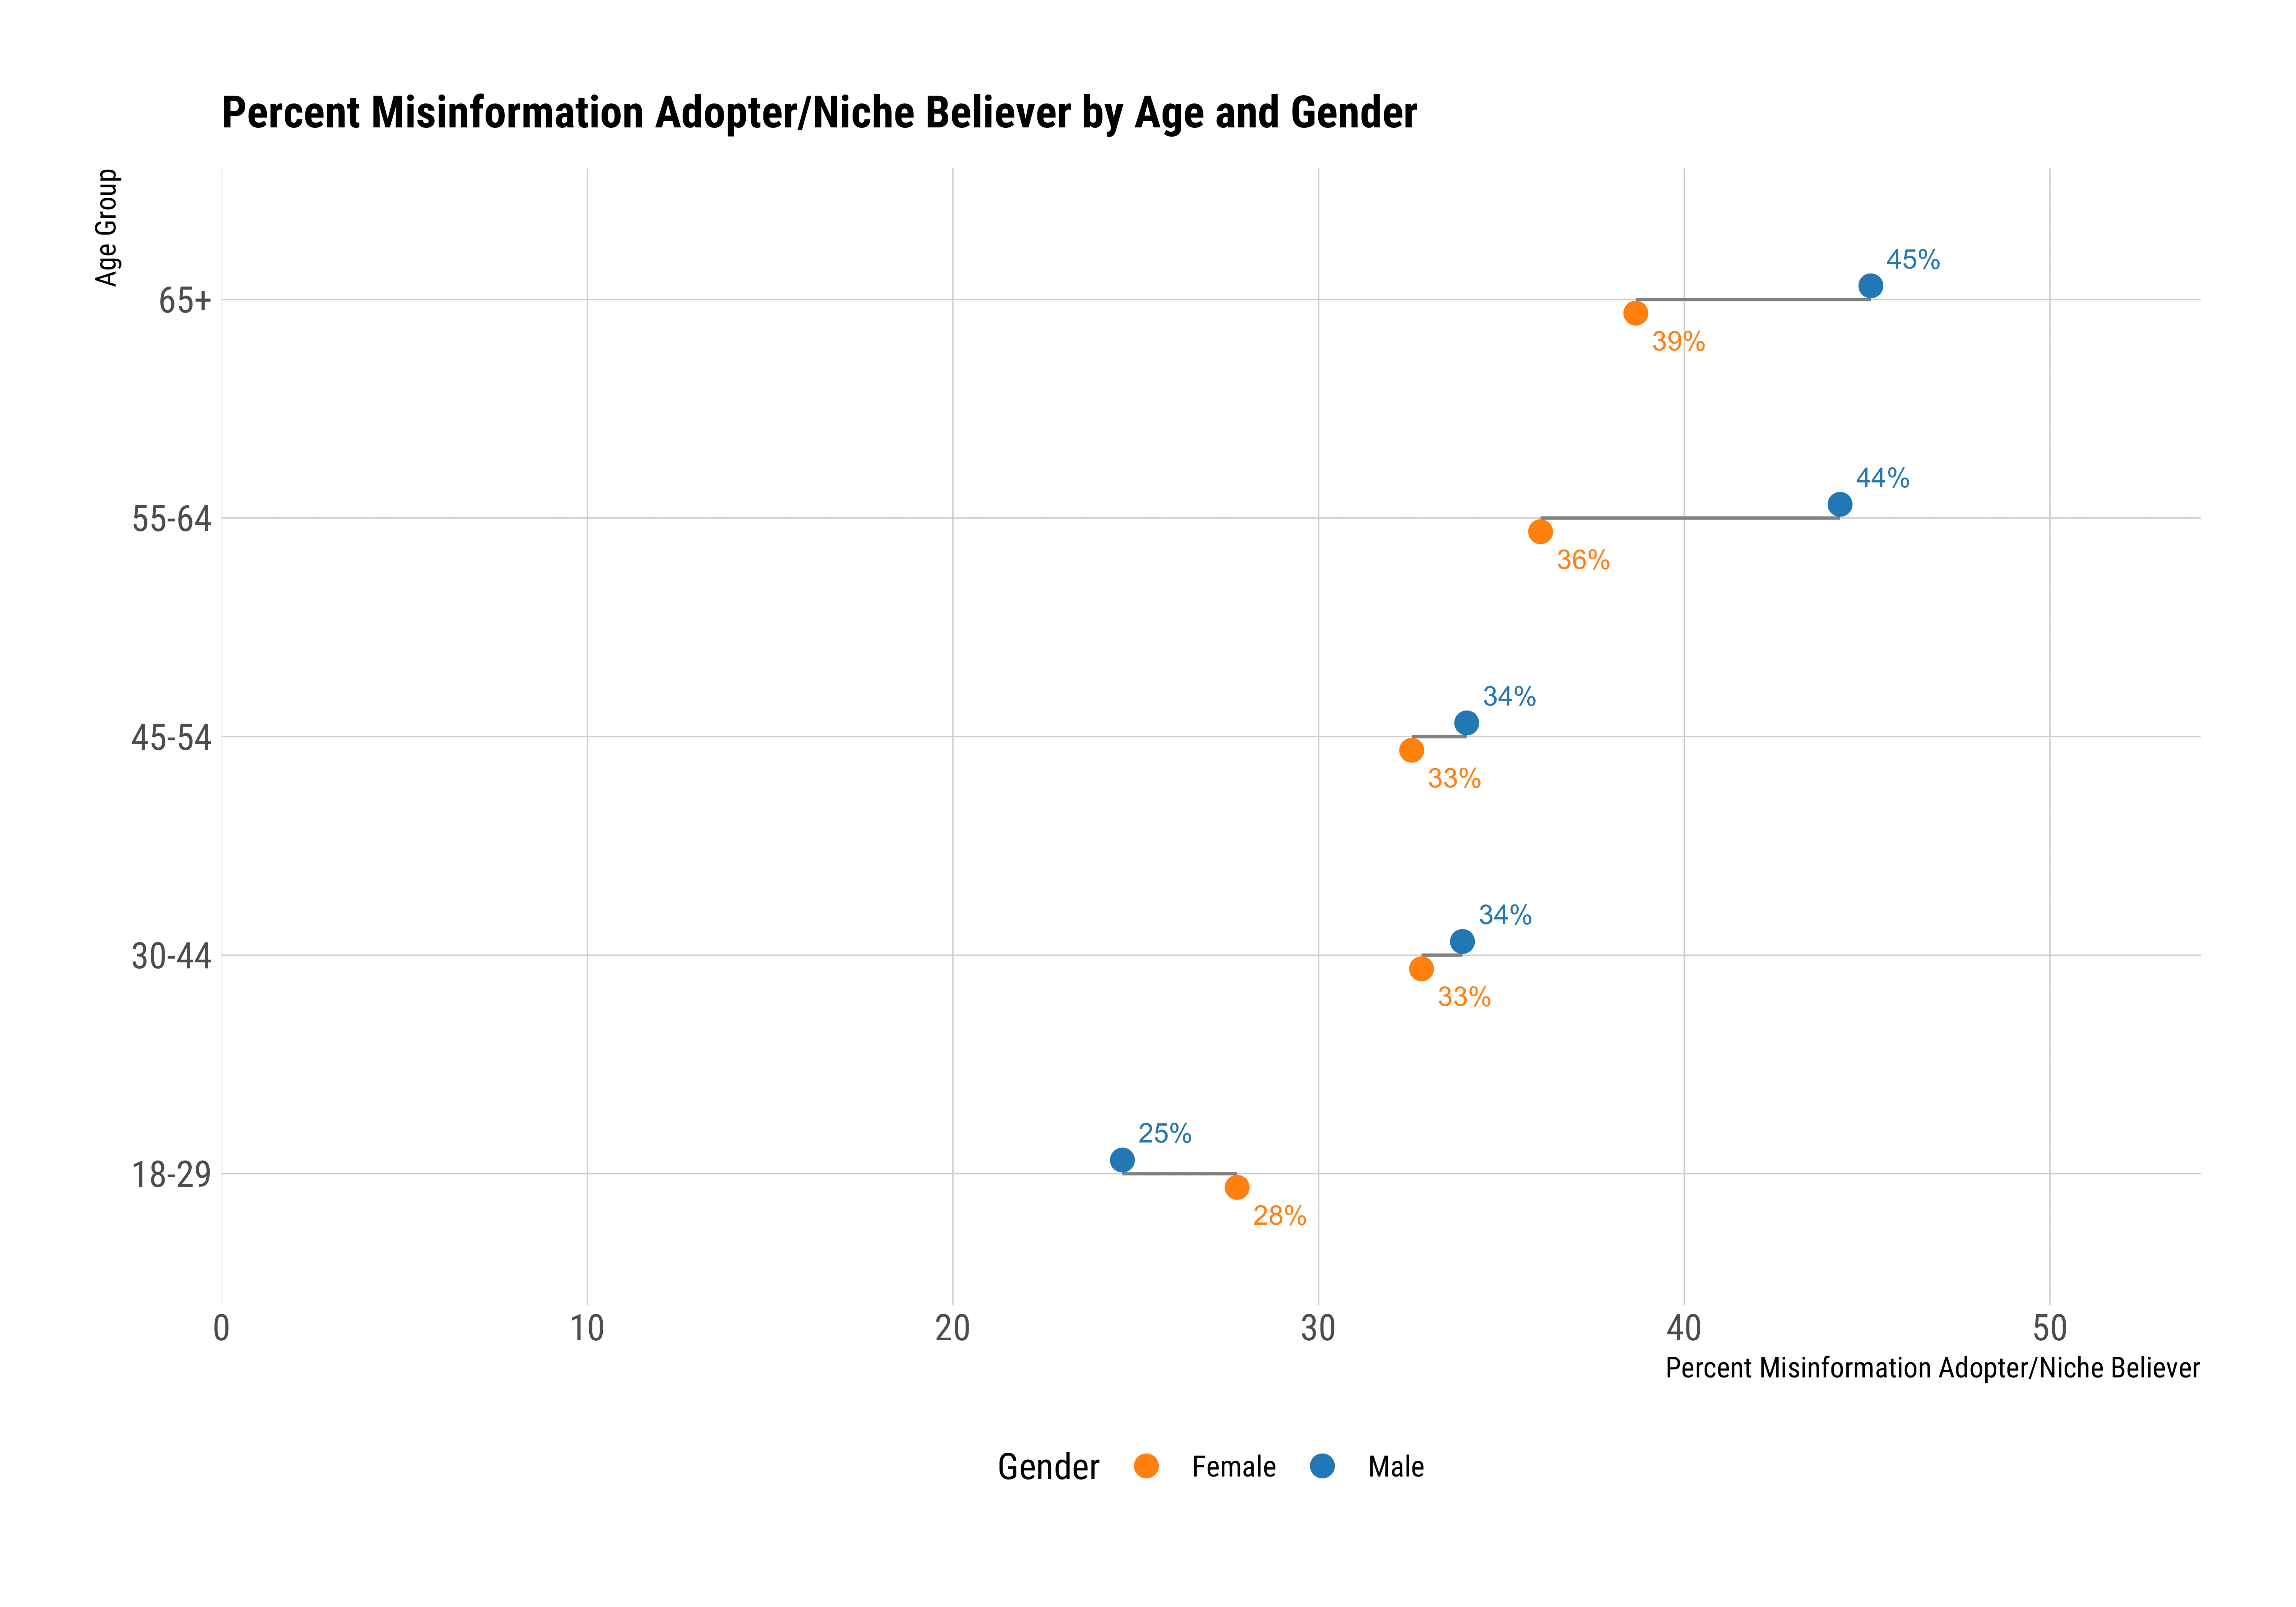
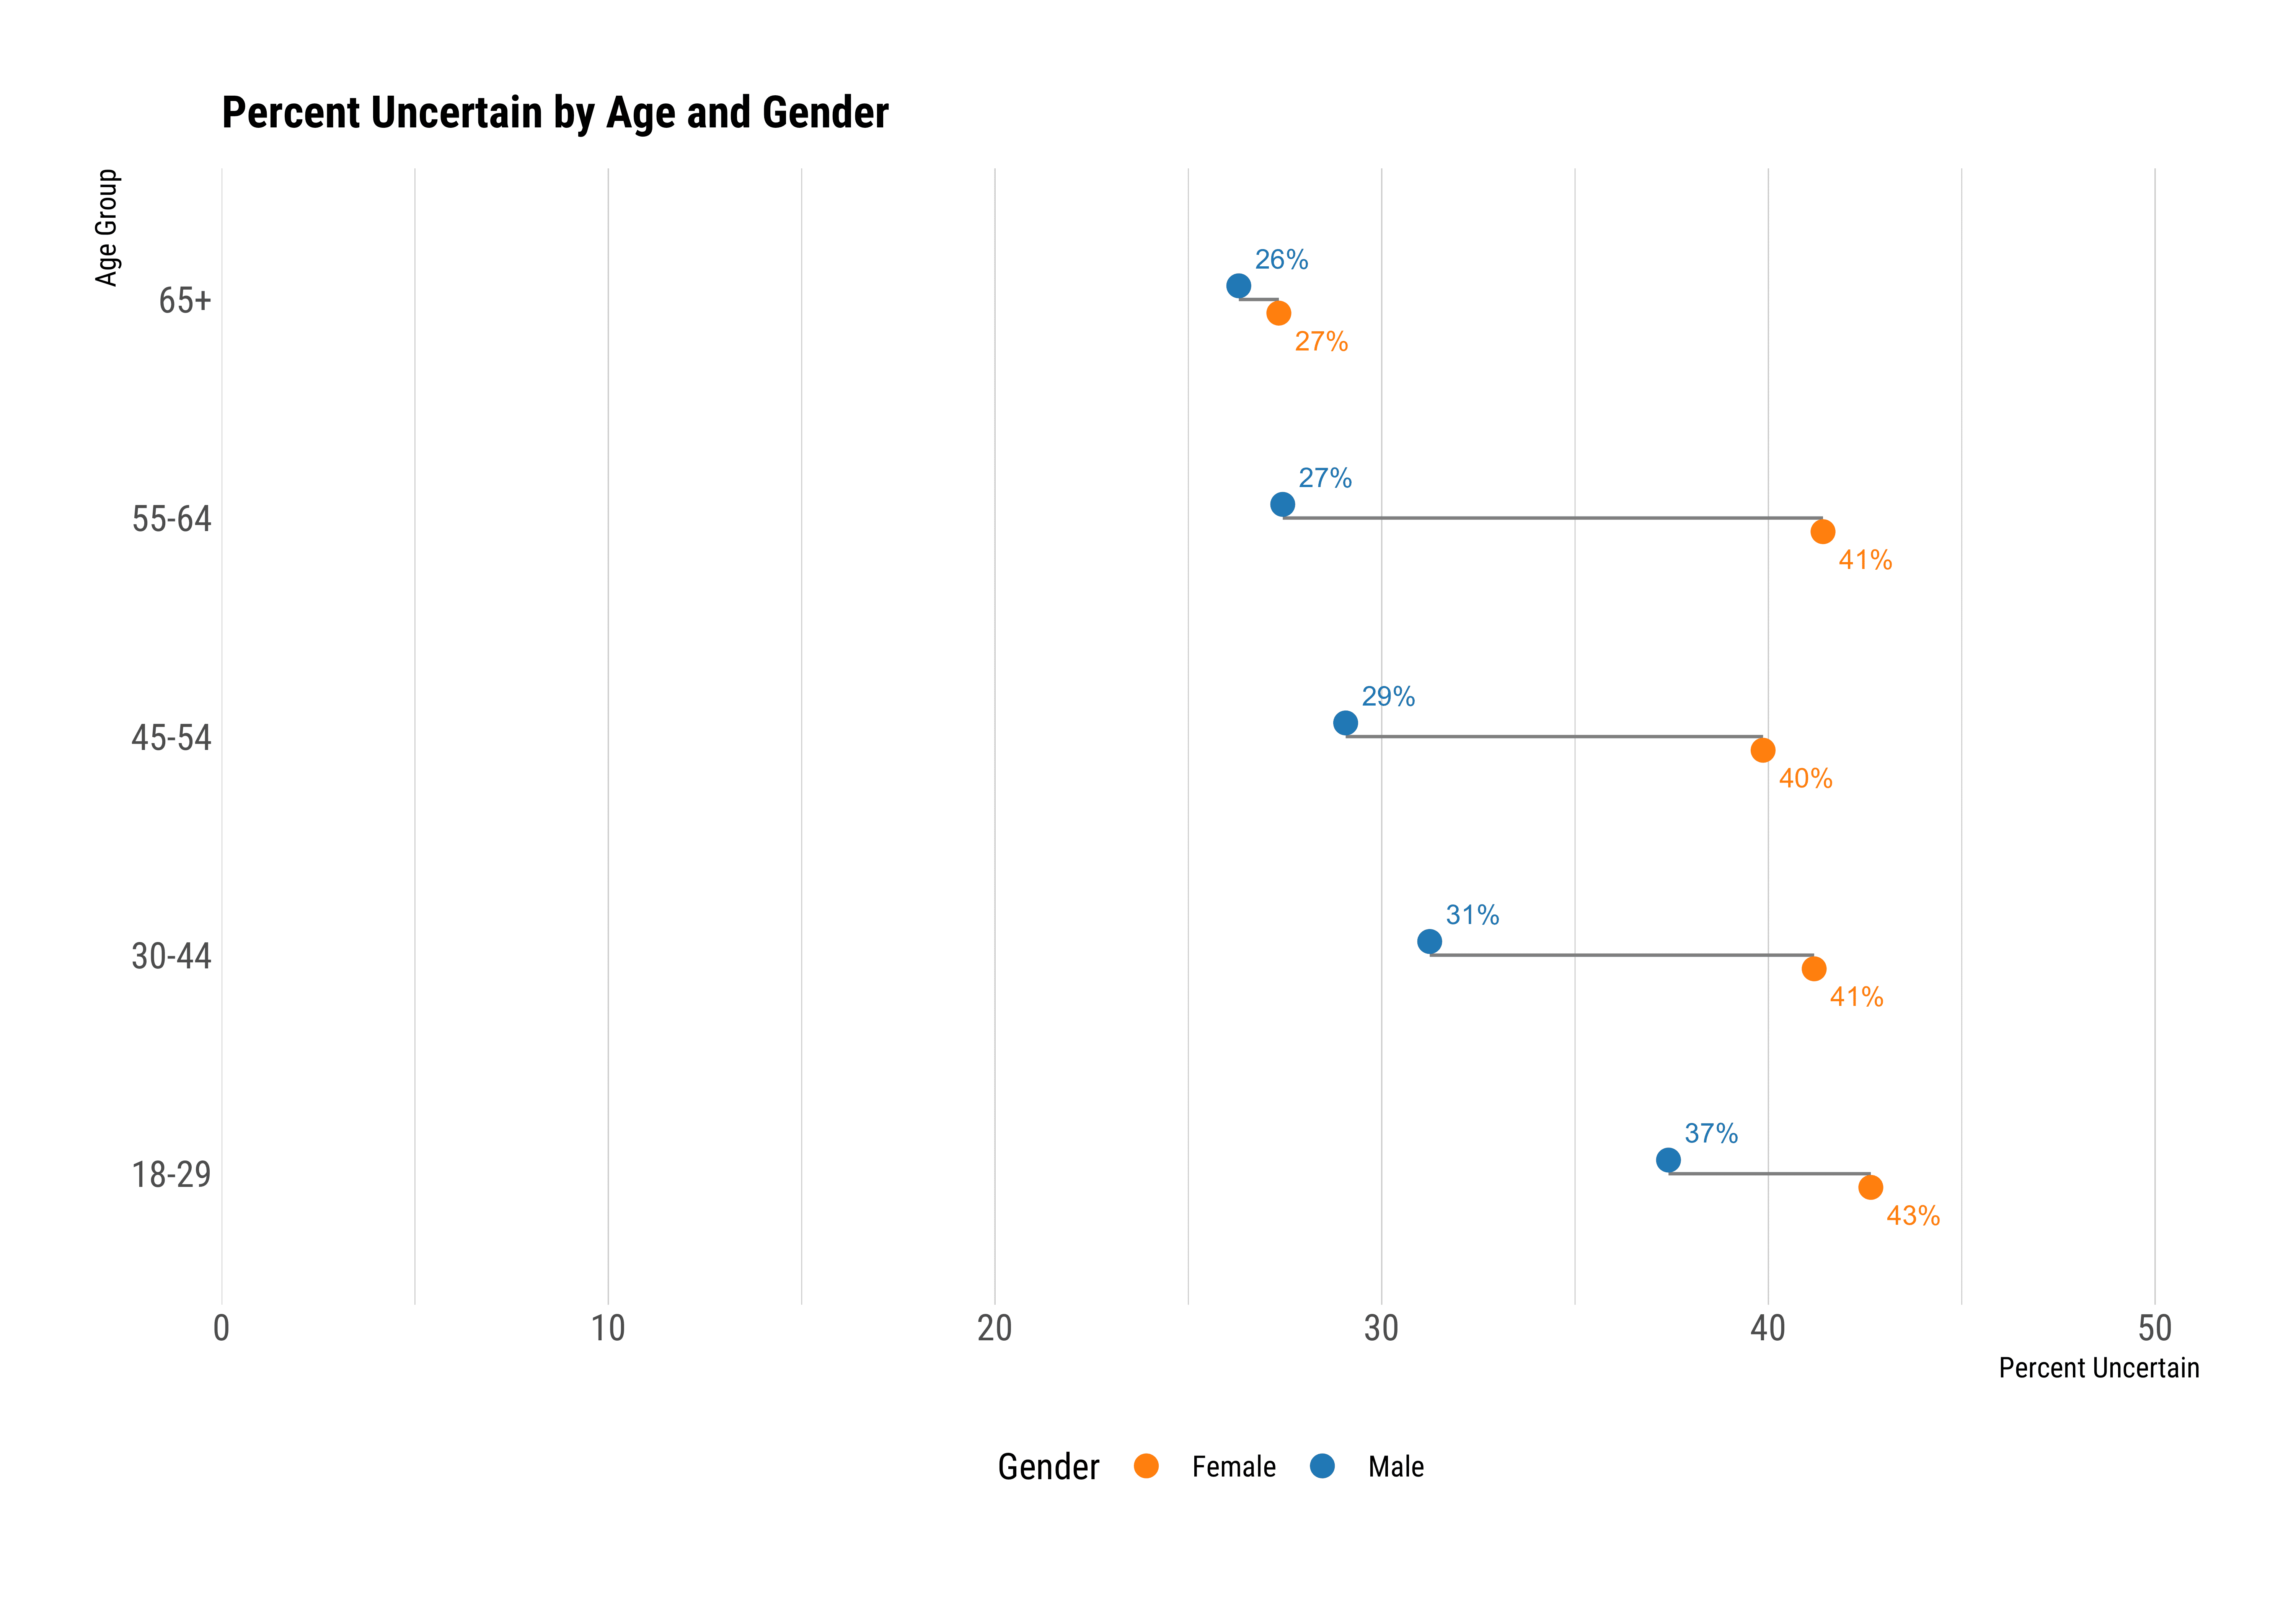
Belief in Misinformation Based on Gender and Age
Among young Latino men and women (ages 18–29), there is virtually no gender gap in misinformation acceptance. However, the gap widens with age, peaking at 55–64, before narrowing again at 65+. For example, Latina women aged 55–64 accept an average of 0.9 misinformation claims, compared to 1.2 claims for Latino men. While the overall effects are modest, it is notable how minuscule the gender difference is among younger Latinos.
The same trend appears within the misinformation-adopting subgroups (“misinformation adopters” and “niche believers”). Among those aged 18–29, 25% of Latino men and 28% of Latina women fall into these groups. The gap increases with age, reaching its widest point at 55–64, where 36% of Latina women and 44% of Latino men belong to these subgroups. At 65+, the gap narrows slightly, with 39% of women and 45% of men falling into these categories.
On uncertainty, a small gender gap exists among young adults (18–29), with 37% of Latino men and 43% of Latina women expressing uncertainty. This gap is largest at ages 55–64, where 27% of Latino men and 41% of Latina women fall into uncertain subgroups.
Bottom Line:
Age differences in misinformation acceptance are often larger than gender differences. Among Latino men, 25% of those aged 18–29 fall into misinformation-adopting subgroups, compared to 45% of those aged 65+—a 20-point increase. Among Latina women, the increase is smaller, from 28% to 39% (an 11-point difference). By comparison, gender differences within specific age groups are much smaller, with a 3-point gap at 18–29 and a 6-point gap at 65+. The exception to this pattern holds for uncertainty, where women are generally more uncertain than men across age groups.
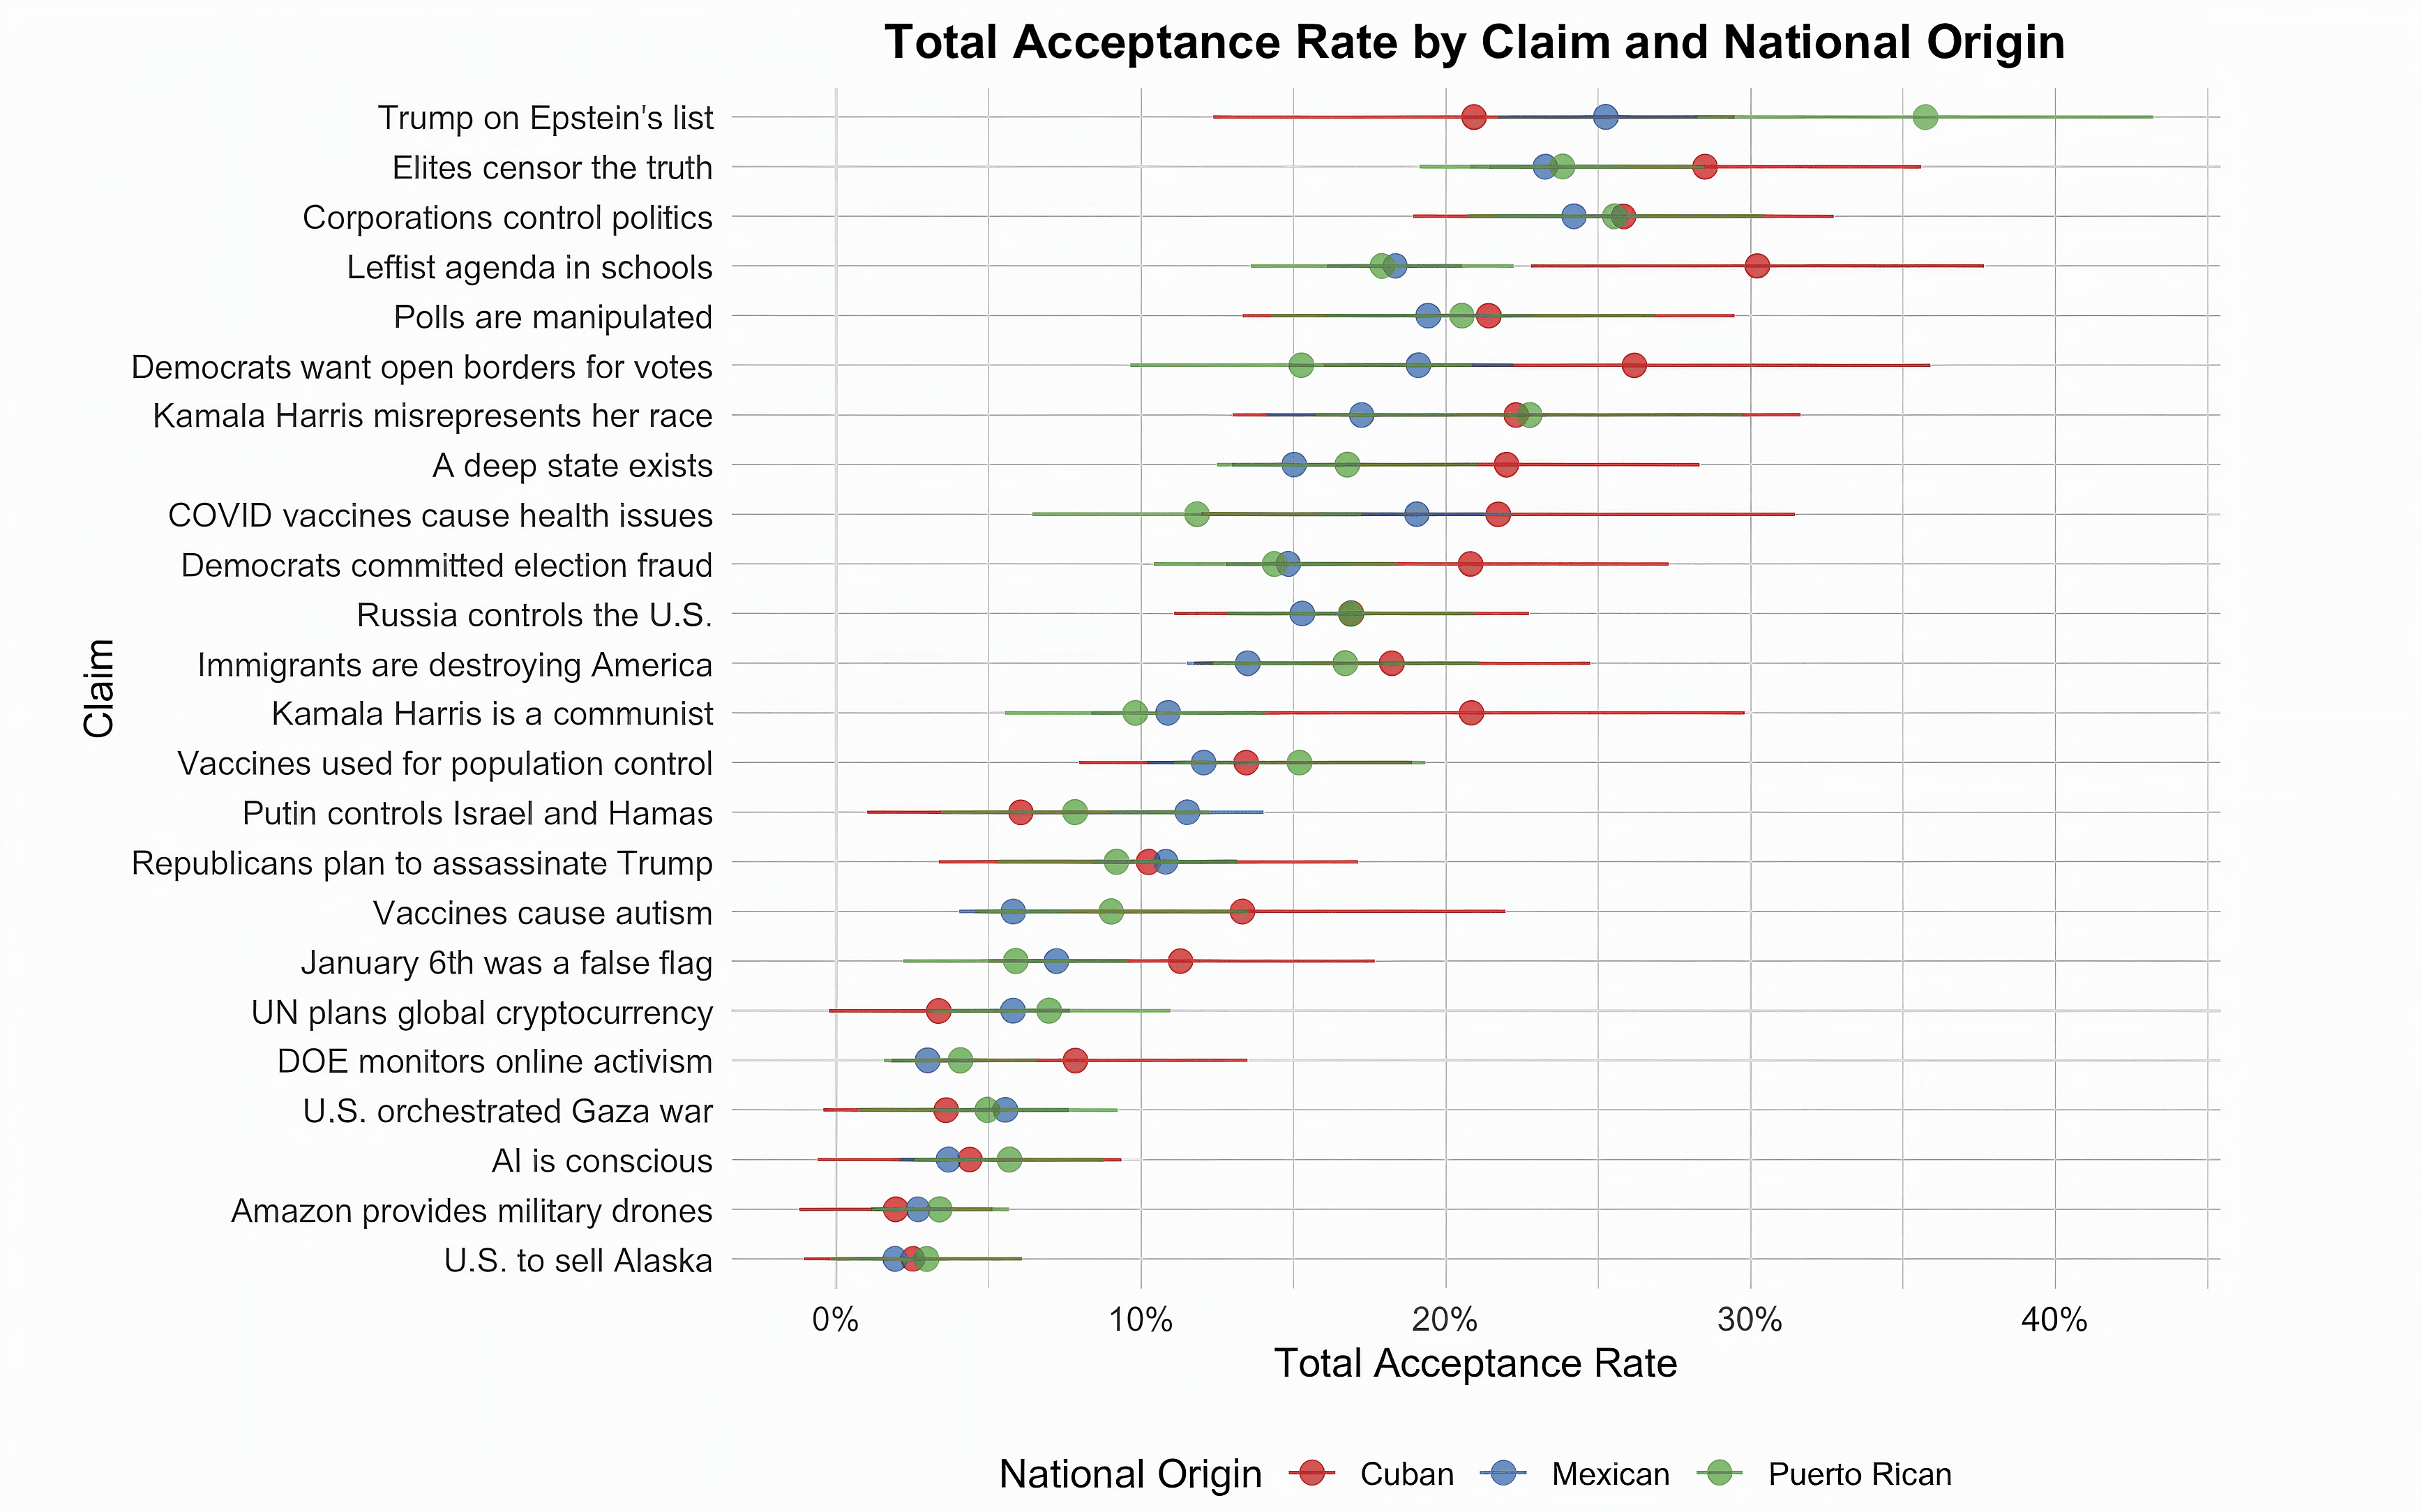
Belief in Misinformation Based on National Origin
Examining a variety of claims and narratives, we observe minimal differences in total misinformation acceptance across major national origin groups.
In only one case, do we observe a statistically significant difference between national origin groups. Specifically, we find a higher rate of belief in the narrative that there is a leftist agenda in schools among Cuban Americans (30%) relative to Mexican Americans and Puerto Ricans (18%).
However, in the vast majority of cases, differences between national origin groups are not statistically distinguishable, in part because of smaller sample sizes.
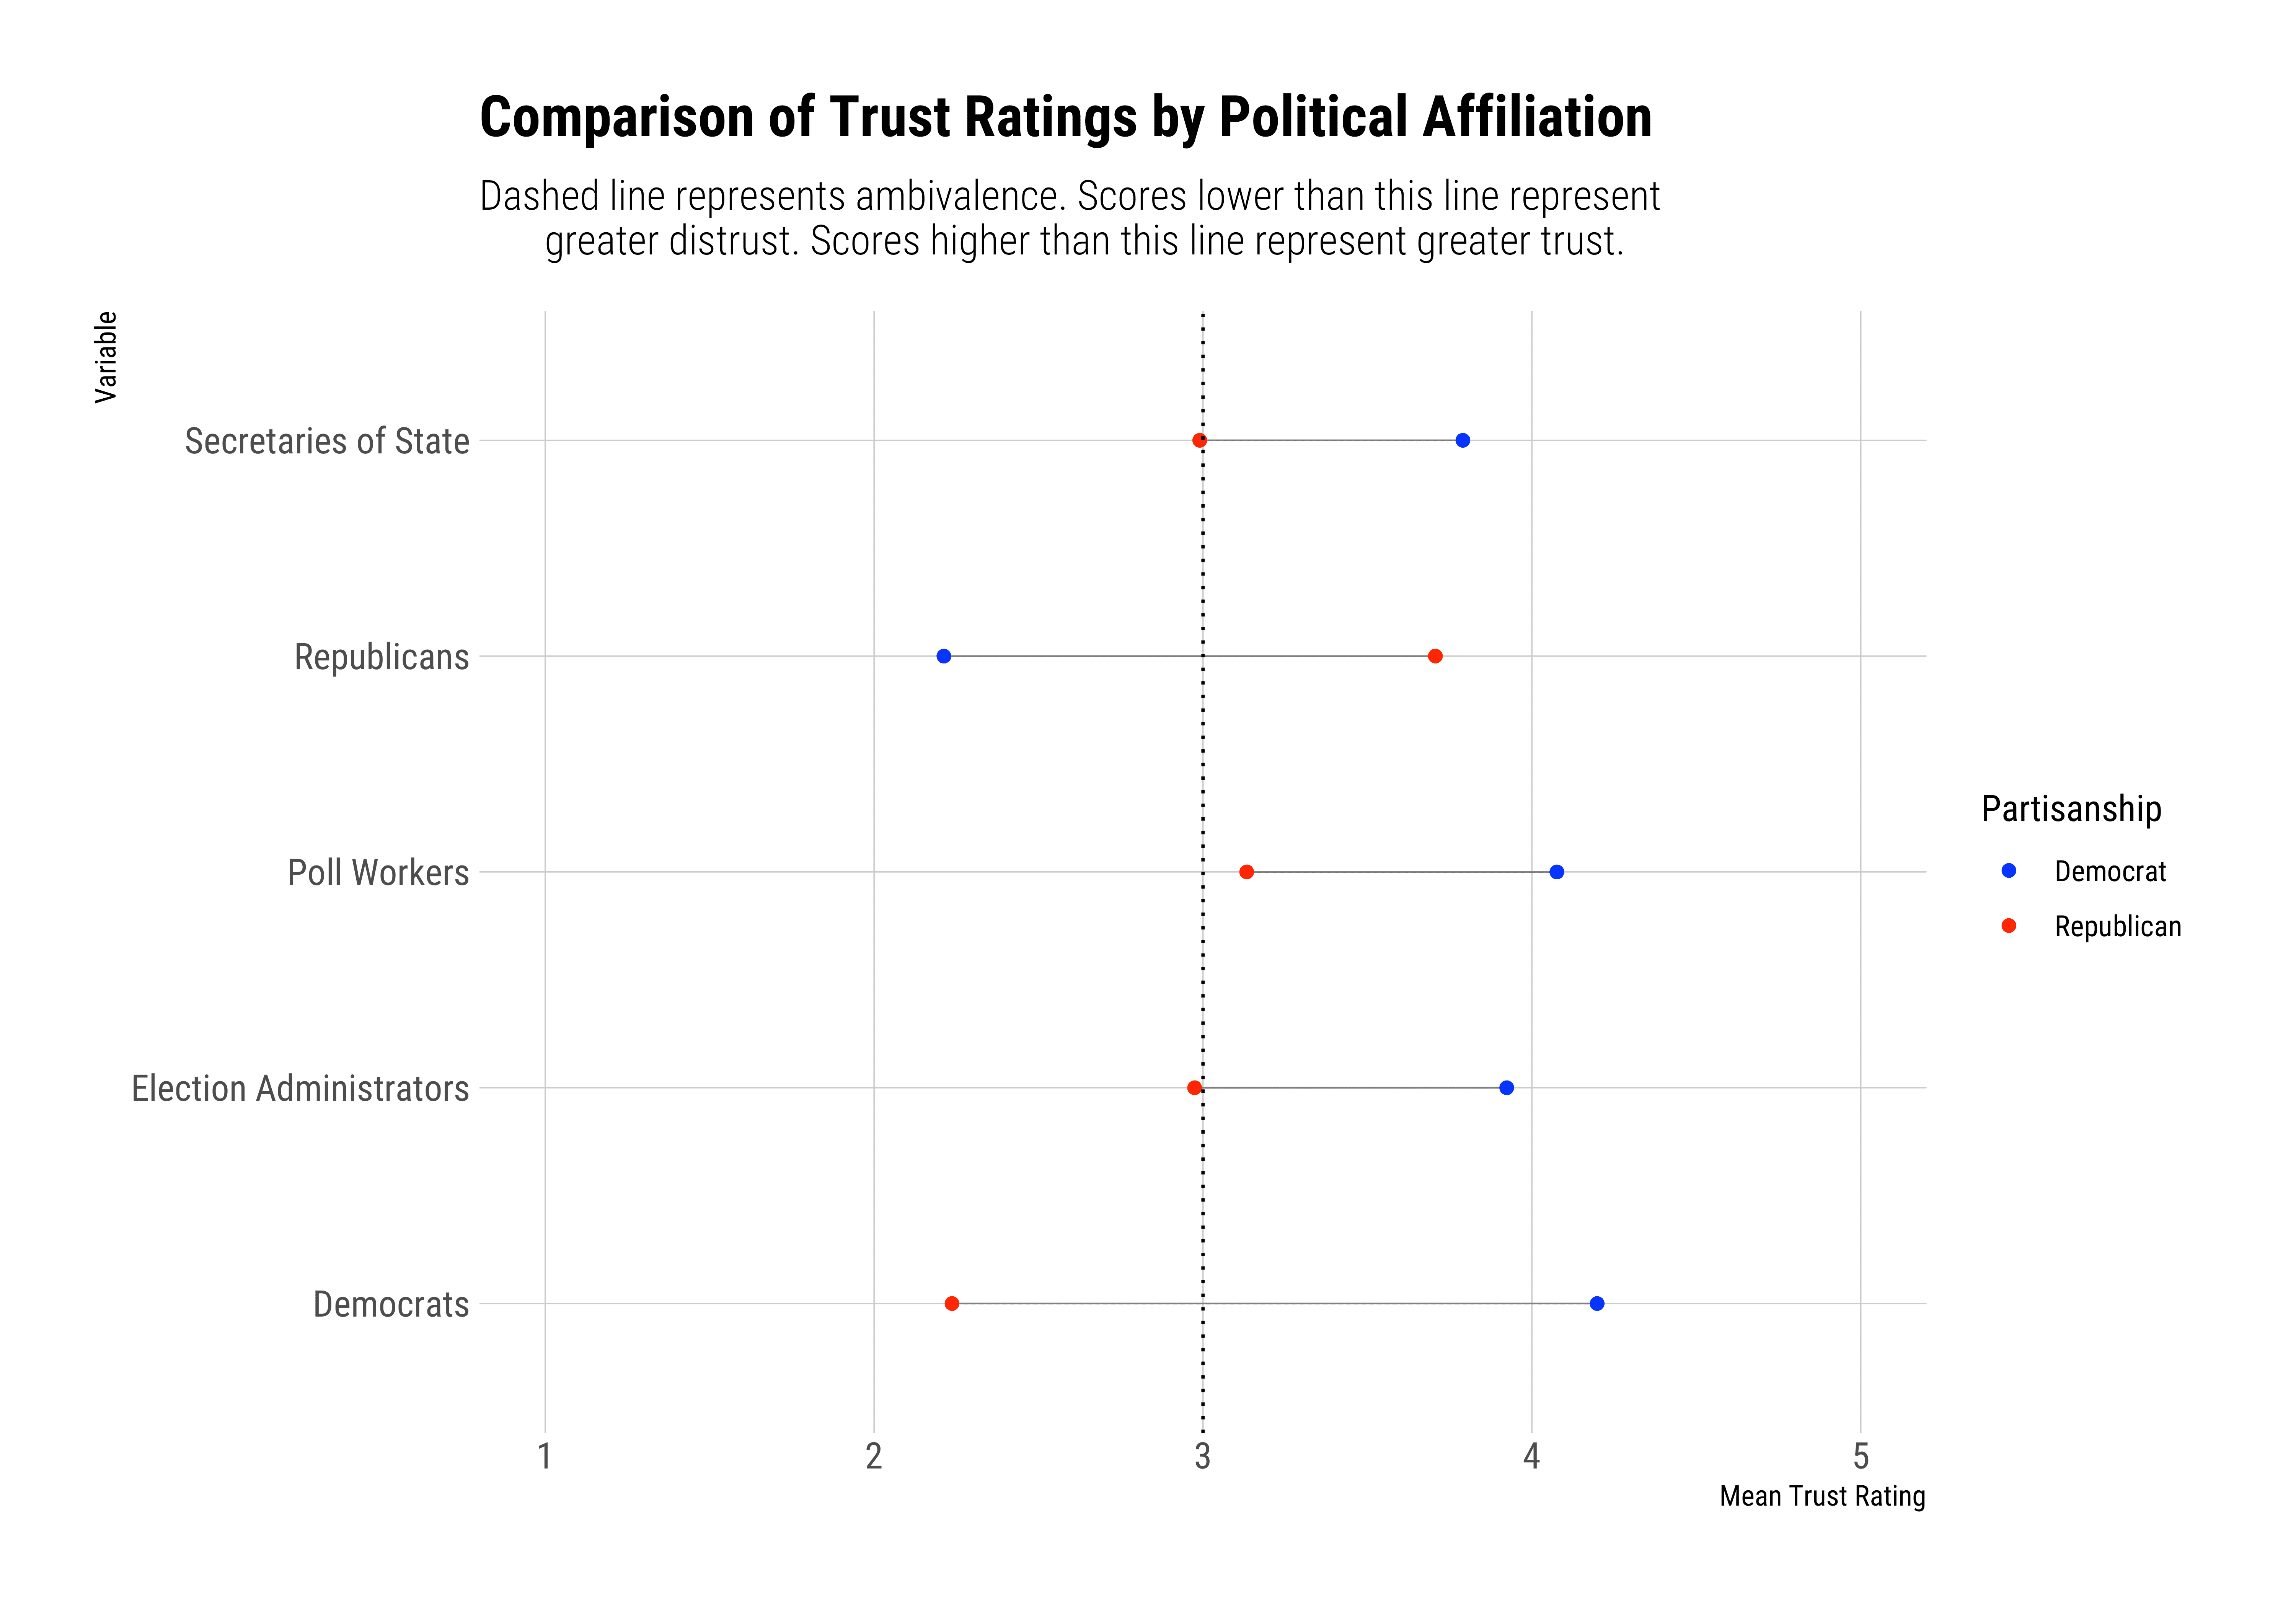
Trust in Elections, Political Figures and Other Actors.
As in our previous report, a comparison of findings continues to highlight significant differences in electoral trust between Latino Republicans and Latino Democrats.
Consistent with earlier analyses, Latino Republicans express more ambivalence (neither trust nor distrust) toward election authorities and actors compared to their Democratic counterparts, who exhibit fairly high levels of trust.
Moreover, as before, neither partisan group expressed confidence in the opposing party to do the right thing on election day. This persistent lack of mutual trust underscores the deep partisan divide in electoral attitudes and likely contributes to heightened suspicions about the integrity of the electoral process.
Together, these findings reaffirm the concerning polarization that poses risks to broader confidence in democratic institutions.
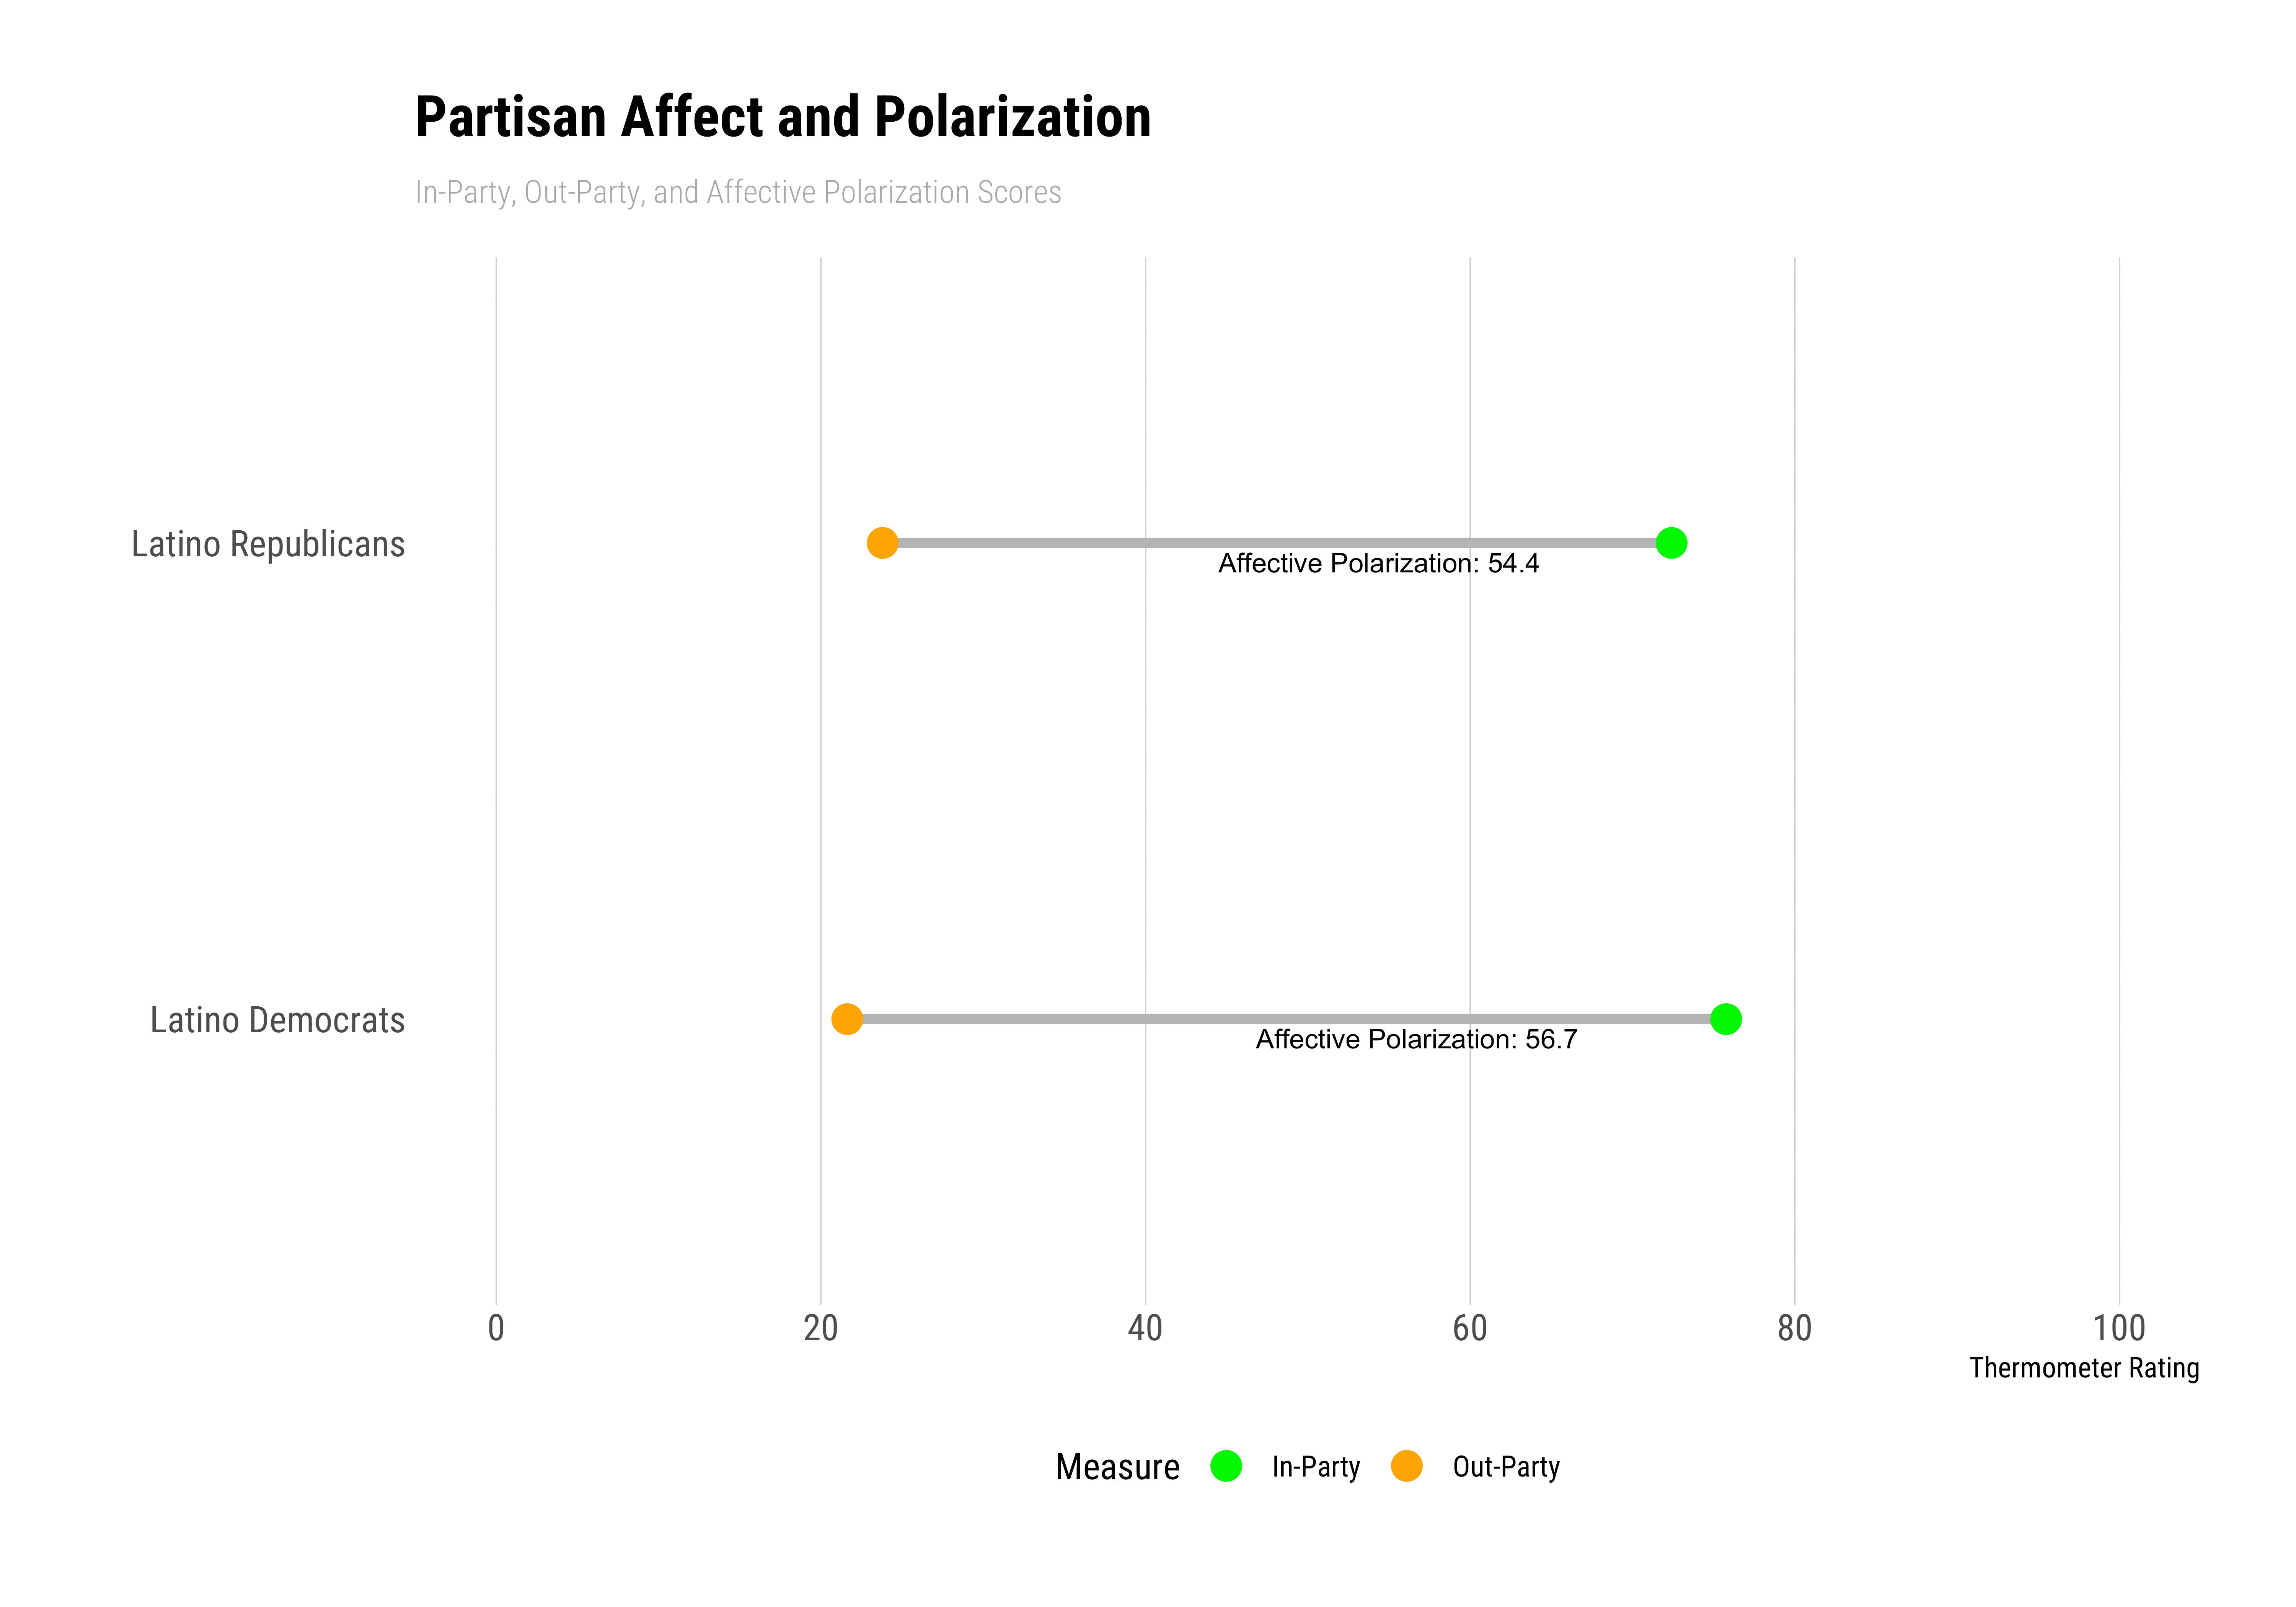
Affective Polarization Among Latinos
Affective polarization refers to the tendency of people to view their own political party positively while holding negative views towards opposing parties. It’s a measure of the emotional divide between political groups, rather than differences in policy positions or ideologies.
To measure affective polarization, researchers typically use “feeling thermometer” ratings, where respondents rate their feelings towards different groups on a scale from 0 (very cold or unfavorable) to 100 (very warm or favorable). Affective polarization is then calculated as the absolute difference between a person’s rating of their own party (in-party) and their rating of the opposing party (out-party).
This measure captures the degree of emotional distance between partisans, reflecting how much more positively they view their own party compared to the opposition. Higher scores indicate greater polarization, suggesting a wider emotional gap between how people feel about their own party versus the other party.
Our analysis reveals significant affective polarization among Latino Democrats and Republicans:
Latino Democrats:
Rate their own party (in-party) at 76 on a 0-100 thermometer scale
Rate Republicans (out-party) at 22
Resulting in an affective polarization score of 57
Latino Republicans:
Rate their own party at 72
Rate Democrats at 24
Resulting in an affective polarization score of 54
These findings indicate substantial partisan divide among Latinos. Both groups view their own party very favorably (above 70 on the thermometer scale) while rating the opposing party quite low (below 25). The affective polarization scores are high for both groups - +57 for Democrats and +54 for Republicans.
These results suggest that affective polarization is a significant phenomenon among Latinos, mirroring trends observed in the broader American electorate. The high polarization scores indicate that Latinos, regardless of their party affiliation, tend to view the opposing party much less favorably than their own, which could have important implications for political discourse and cooperation within the Latino community and beyond.
As an aside, it’s worth noting the thermometer ratings given by Latino Independents: - Latino Independents rate Democrats at 34 on the thermometer scale - They also rate Republicans at 34.
These nearly identical ratings suggest that Latino Independents view both major parties with similar levels of lukewarm sentiment.
Belief Differences Among Harris and Trump Supporters, and Those In Between
When examining different voter subgroups defined by their feelings towards Harris and Trump, we observe interesting patterns. Ambivalent voters, who hold similar feelings toward both candidates on a 0-100 scale that ranges from cold to warm sentiment, align more closely with Trump supporters on border-related claims but side with Harris supporters regarding criticisms of Trump’s motivations and age. This indicates that these persuadable voters are selectively accepting narratives from both sides. Put another way, weaknesses for Trump among these voters in the “persuadable middle” involve his age and motivations, whereas Harris’s handling of the border is perceived more negatively among this group.
A Silver Lining: Rising Trust in Democratic Institutions
The increase in trust across various democratic institutions is one of the most reassuring developments from our study. Confidence in secretaries of state and election administrators has grown, indicating that Latinos are more likely to believe these officials will conduct fair and accurate elections. This trend is particularly important given the context of recent years, where trust in democratic processes has been challenged.
On average, across the full sample, trust in Secretaries of State has increased by 3 points from 41% to 44% across survey waves. Election administrators have also seen gains in trust, with a movement from 43% to 47% across the two waves.
The percentage of Latino voters in the sample who trust Democrats to “do the right thing” during Election Day has jumped from 41% to 45%. Regarding Republicans, roughly 31% of Latinos in our two waves reported trusting that they will do the right thing. Estimates have remained stable at relatively low levels of trust.
The growing trust in the electoral system may serve as a counterbalance to the negative effects of election-specific misinformation. As Latino voters place more faith in the institutions responsible for ensuring fair elections, they may be less influenced by unfounded claims of widespread fraud or manipulation.
Attitudes About Immigration Among Latinos
Our study finds strong positive attitudes toward immigrants in general among Latino voters, with high agreement that immigrants contribute positively to communities and society at large. This widespread support likely reflects personal and immigrant histories within the community. However, attitudes become more complex when discussing unauthorized immigration.
Nearly half of respondents express concerns that increased unauthorized migration can bring increased crime (47%) or strain local resources (44%). Interestingly, the notion that immigrants “take jobs” from native-born workers is not as widely accepted in comparison – 29% agree with this claim.
This suggests that while there are concerns about certain aspects of immigration, Latino voters recognize the overall benefits of immigration and may not respond to simplistic or alarmist messaging on the issue.
The statements break down as follows:
Immigrants take jobs away from people born in the U.S.: 52.1% disagree, 29.1% agree
Immigrants can be a drain on local resources: 35.8% disagree, 43.7% agree
Increased illegal immigration brings increased crime: 34% disagree, 47.1% agree
Immigrants improve America by bringing new ideas and cultures: 16.3% disagree, 63.5% agree
Immigrants positively contribute to American communities: 15.4% disagree, 63.9% agree
Latinos and AI
Note: This analysis relies on the Latino samples of our wave 1 and 2 polls, one in March/April and one in September.
By and large, Latino attitudes toward AI remained ambivalent in September, with 31% viewing it as a positive development, 27% seeing it negatively, and the rest remaining neutral.
Adoption of AI tools remains modest but is increasing; regular ChatGPT users rose from 15% in March/April to 20% in September. Trust in the accuracy of AI output among users has also grown, from 60% in March/April to 66% in September.
Yet while many Latinos are hopeful about AI's potential—for example, 56% believe it can enable medical discoveries and 44% see it as a tool to enhance productivity—concerns about its economic impacts are far more prevalent, with 66% agreeing that AI will “take jobs away from ordinary people.”
Policy preferences reflect this caution, as 69% in September (Wave 2) agreed on the urgent need for AI regulation, compared to 68% in March/April (Wave 1).
Below DDIA breaks down the findings from both waves of polling.
AI Usage
Question: Do you use any of the following tools on a daily basis? Select all that apply.
ChatGPT:
15% use in Wave 1
20% use in Wave 2
"Never used any of these tools":
50% in Wave 1
42% in Wave 2
Overall Sentiment
Question: Do you believe that artificial intelligence technology is a [positive, negative,] or neutral development in society?
Positive sentiment:
27% in Wave 1
31% in Wave 2
Negative sentiment:
27% in both waves
Neutral sentiment (“Neither positive nor negative”):
47% in Wave 1
42% in Wave 2
Economic Impacts
Question: I’m worried that artificial intelligence will take jobs away from ordinary people.
Agree/Somewhat Agree:
Wave 1 total: 66% (21% strongly agree, 23% agree, 22% somewhat agree)
Wave 2 total: 66% (21% strongly agree, 23% agree, 22% somewhat agree)
Neutral (“Neither agree nor disagree”):
Wave 1: 21%
Wave 2: 19%
Disagree/Strongly Disagree (remainder):
Wave 1: 14%
Wave 2: 15%
Trust in AI
Question: (Asked among users only) How much do you trust artificial intelligence applications (e.g., ChatGPT, Bard/Gemini) to provide accurate output?
Trust/Somewhat Trust:
Wave 1 total: 60% (18% trust, 42% somewhat trust)
Wave 2 total: 66% (17% trust, 49% somewhat trust)
Neutral (“Neither trust nor distrust”):
Wave 1: 29%
Wave 2: 23%
Distrust/Strongly Distrust (remainder):
Wave 1: 11%
Wave 2: 11%
Stricter AI Regulations
Question: There is a pressing need for stricter regulations and oversight of artificial intelligence technologies.
Agree/Somewhat Agree:
Wave 1 total: 68% (27% strongly agree, 23% agree, 18% somewhat agree)
Wave 2 total: 69% (26% strongly agree, 24% agree, 19% somewhat agree)
Neutral (“Neither agree nor disagree”):
Wave 1: 24%
Wave 2: 24%
Disagree/Strongly Disagree (remainder):
Wave 1: 10%
Wave 2: 7%
AI’s Perceived Impact on Productivity
Question: Artificial intelligence will make us more productive and efficient.
Agreement (Strongly agree + Agree + Somewhat agree):
Wave 1: 43%
Wave 2: 44%
Neutral (“Neither agree nor disagree”) responses:
Stable at 29%
Disagreement (remainder):
Wave 1: 28%
Wave 2: 27%
AI and Medical Discoveries
Question: Artificial intelligence will increase our ability to develop new medicines and technologies.
Agreement (Strongly agree + Agree + Somewhat agree):
Wave 1: 53%
Wave 2: 56%
Neutral (“Neither agree nor disagree”) responses:
Wave 1: 32%
Wave 2: 29%
Disagreement:
Stayed stable at 15%
Looking to the Future
2024 was a transformational year for democracy, digital technologies, and media ecosystems. While more voters than ever in history headed to the polls to elect new leaders, political campaigns and individual content creators harnessed a decentralized online world to cement presence and influence on media like podcasts, Youtube, Instagram, TikTok, where an emotionally exhausted populace spent more time than ever consuming content that helped them “make sense of the world.”
While U.S. Latinos are not inherently more susceptible to misinformation than the general population, factors like partisanship and distrust contribute to communities accepting misinformation to varying degrees. Trust dynamics reveal significant divides based on political affiliation, with different sources viewed as reliable or untrustworthy. Engagement with misinformation is influenced by individuals' political interests and news consumption habits, and, importantly, certain narratives and conspiracy theories, such as the idea of corporations dominating politics and elites plotting to censor the truth or to keep society down, have resonated significantly. All the while, social media and messaging applications widely used by Latinos, like WhatsApp, will continue to be key vectors for spreading misinformation.
Finally, as AI dominates the new Trump Administration’s technology agenda, it is important to recognize that while only around 20% of Latinos regularly used generative AI tools in 2024, adoption will no doubt increase significantly in 2025, even as research shows there’s widespread concern regarding AI's potential to impact jobs and democracy.
Moving forward, as misinformation spreads and the use of AI technologies rises, it’s critical to create culturally competent content that respects and informs diverse Latino audiences. This involves leveraging shared values, employing evidence, and partnering with authentic Latino voices.
2025 will solidify this new “digital democracy’s” profound impact on inclusive democratic participation. Fostering research and guiding interventions that combat online harms in service of Latinos in the U.S. and across the Americas, and centering Latinos and Latin Americans in conversations about the future of the digital information ecosystem, will be key to ushering in a new era of open societies committed to democratic values.
As we look to the future, DDIA will harness the findings of a year’s worth of polling to meet the following objectives:
Objective 1: Shape Knowledge About Latinos and Online Harms - Shape understanding of the systemic, social and behavioral factors that contribute to the borderless spread of false, misleading, and hate-fueled information in Latino spaces online.
Objective 2: Build Community Resilience to Authoritarianism and Manipulation - Incubate interventions that counter and build resilience against online harms, in service of Latino communities.
Objective 3: Strengthen Policy Solutions for a More Equitable, Healthier Internet - Center Latino and Latin American experiences in policy discussions and decisions made about the future of the Internet and online world.
More than ever, developing targeted strategies that empower Latino communities against misinformation and ensure they have a voice in the shaping of AI ecosystems alongside community leaders and policymakers will be imperative for strengthening resilience within our communities and promoting a healthier information ecosystem for democracy.
Acknowledgments
The Digital Democracy Institute of the Americas would like to thank Yamil Velez for leading the analysis of the September poll featured in this report. This analysis would not have been possible without his expertise and talent. DDIA would also like to thank YouGov for their partnership and support in the execution of this survey. It was a pleasure working with this team in 2024.
Thank you also to Donald Partyka, with whom we’ve long worked, for their always engaging designs of our deliverables.
As always, DDIA would also like to extend a warm thank you to its Board of Directors and Advisory Council for their continued support and guidance, as well as to our research consultants.
Access the Report PDF:
Download